

 chart
onion diagram
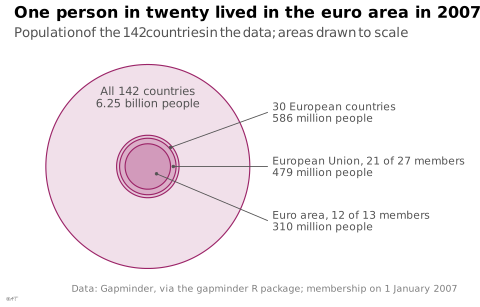
also: onion modelSet diagram of concentric circles in which each set lies strictly inside the one around it, from the most general to the most specific.
Classification
- chart
- sets › set diagrams
- the name evokes: food
Channels
 area; secondary: set size (proportional variant)
 spatial region; main: layer
 color hue; secondary: layer
Scientific literature
OpenAlex: 25 papers since 2010, 28% in the last five years; mostly in Engineering, Business, Management and Accounting, Social Sciences; Wikidata
R packages
R code of the ggplot2 example
library(ggplot2)
library(dplyr)
library(ggforce)
library(gapminder)
## Four nested sets of countries in 2007, drawn as concentric circles whose
## areas are their populations: the data's 142 countries, their European
## countries, the European Union, the euro area.
## Membership on 1 January 2007: the EU had 27 members (Bulgaria and Romania
## joined that day), the euro area 13 (Slovenia joined that day). Gapminder
## lacks Cyprus, Estonia, Latvia, Lithuania, Luxembourg and Malta, about
## 9 million people: 21 EU members and 12 euro members remain.
eu <- c("Austria", "Belgium", "Bulgaria", "Czech Republic", "Denmark", "Finland",
"France", "Germany", "Greece", "Hungary", "Ireland", "Italy", "Netherlands",
"Poland", "Portugal", "Romania", "Slovak Republic", "Slovenia", "Spain",
"Sweden", "United Kingdom")
euro <- c("Austria", "Belgium", "Finland", "France", "Germany", "Greece", "Ireland",
"Italy", "Netherlands", "Portugal", "Slovenia", "Spain")
countries <- gapminder |>
filter(year == 2007) |>
mutate(pop = as.numeric(pop), country = as.character(country))
europe <- countries$country[countries$continent == "Europe"]
## Each set lies strictly inside the one around it.
stopifnot(all(euro %in% eu), all(eu %in% europe))
sets <- tibble(
label = c("All 142 countries", paste(length(europe), "European countries"),
"European Union, 21 of 27 members", "Euro area, 12 of 13 members"),
pop = c(sum(countries$pop), sum(countries$pop[countries$country %in% europe]),
sum(countries$pop[countries$country %in% eu]),
sum(countries$pop[countries$country %in% euro]))
) |>
mutate(r = sqrt(pop / 1e9 / pi),
people = ifelse(pop >= 1e9, sprintf("%.2f billion people", pop / 1e9),
sprintf("%.0f million people", pop / 1e6)))
stopifnot(!is.unsorted(rev(sets$pop), strictly = TRUE))
## The three inner sets are named on the right, each by a segment that ends
## in the middle of its ring (or of the inner disc).
R <- sets$r[1]
inner <- sets[-1, ] |>
mutate(r_mid = (r + c(r[-1], 0)) / 2,
angle = c(40, 0, -40) * pi / 180,
x = r_mid * cos(angle), y = r_mid * sin(angle),
xend = R + 0.25, yend = c(0.75, 0, -0.75))
p <- ggplot() +
geom_circle(data = sets, aes(x0 = 0, y0 = 0, r = r), colour = "#9b2367",
fill = "#9b2367", alpha = 0.14, linewidth = 0.4) +
annotate("text", x = 0, y = R * 0.68, size = 3, colour = "#535353", lineheight = 0.9,
label = paste0(sets$label[1], "\n", sets$people[1])) +
geom_segment(data = inner, aes(x = x, y = y, xend = xend, yend = yend),
colour = "#535353", linewidth = 0.3) +
geom_point(data = inner, aes(x = x, y = y), colour = "#535353", size = 0.6) +
geom_text(data = inner, aes(x = xend + 0.06, y = yend, label = paste0(label, "\n", people)),
hjust = 0, size = 2.8, colour = "#535353", lineheight = 0.9) +
coord_equal(xlim = c(-R - 0.05, R + 2.6), clip = "off") +
labs(title = "One person in twenty lived in the euro area in 2007",
subtitle = "Population of the 142 countries in the data; areas drawn to scale",
x = NULL, y = NULL,
caption = "Data: Gapminder, via the gapminder R package; membership on 1 January 2007") +
theme_lex_viz(grid = "", arrows = "") +
theme(axis.text = element_blank())Sources (1)
Cite this entry
Stable addresshttps://dataviz.adrientaudiere.com/en-only/term/onion-diagram.html
ReferenceTaudière Adrien. 2026. onion diagram. In Visualization Vocabulary, version 1.0.0. IdEst. https://dataviz.adrientaudiere.com/en-only/term/onion-diagram.html
BibTeX
@incollection{taudiere2026-onion-diagram,
  author    = {Taudière, Adrien},
  title     = {onion diagram},
  booktitle = {Visualization Vocabulary},
  year      = {2026},
  version   = {1.0.0},
  publisher = {IdEst},
  url       = {https://dataviz.adrientaudiere.com/en-only/term/onion-diagram.html},
  note      = {CC0 1.0}
}Page created on 2026-11-09. Text last changed on 2026-11-12. Images last changed on 2026-11-11. Numbers computed on 2026-10-22.