
 chart
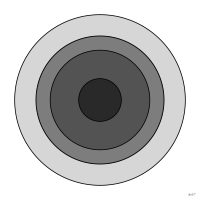
onion diagram
also: onion modelSet diagram of concentric circles in which each set lies strictly inside the one around it, from the most general to the most specific.
diagramme en oignon
Diagramme d'ensembles en cercles concentriques où chaque ensemble est strictement contenu dans celui qui l'entoure, du plus général au plus particulier.
Forme d'un diagramme d'Euler à ensembles emboîtés. Les couches ont une aire proportionnelle à leur effectif (eulerr) ou restent conceptuelles, comme dans les schémas de gestion ; à ne pas confondre avec le graphique en anneau ni le diagramme en rayons de soleil, qui découpent un tout en parts.
Classification
- chart
- sets › set diagrams
- the name evokes: food
Channels
 area; secondary: set size (proportional variant)
 spatial region; main: layer
 color hue; secondary: layer
Attestation
- French term: Common usage, not attested by a source
Scientific literature
OpenAlex: 25 papers since 2010, 28% in the last five years; mostly in Engineering, Business, Management and Accounting, Social Sciences; Wikidata
R packages
- R
eulerr::euler(); GitHub Ensembles emboîtés.
R code of the ggplot2 example
library(ggplot2)
library(dplyr)
library(ggforce)
library(gapminder)
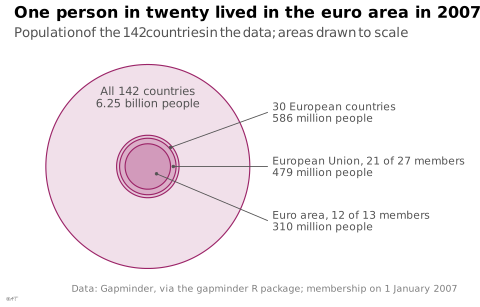
## Four nested sets of countries in 2007, drawn as concentric circles whose
## areas are their populations: the data's 142 countries, their European
## countries, the European Union, the euro area.
## Membership on 1 January 2007: the EU had 27 members (Bulgaria and Romania
## joined that day), the euro area 13 (Slovenia joined that day). Gapminder
## lacks Cyprus, Estonia, Latvia, Lithuania, Luxembourg and Malta, about
## 9 million people: 21 EU members and 12 euro members remain.
eu <- c("Austria", "Belgium", "Bulgaria", "Czech Republic", "Denmark", "Finland",
"France", "Germany", "Greece", "Hungary", "Ireland", "Italy", "Netherlands",
"Poland", "Portugal", "Romania", "Slovak Republic", "Slovenia", "Spain",
"Sweden", "United Kingdom")
euro <- c("Austria", "Belgium", "Finland", "France", "Germany", "Greece", "Ireland",
"Italy", "Netherlands", "Portugal", "Slovenia", "Spain")
countries <- gapminder |>
filter(year == 2007) |>
mutate(pop = as.numeric(pop), country = as.character(country))
europe <- countries$country[countries$continent == "Europe"]
## Each set lies strictly inside the one around it.
stopifnot(all(euro %in% eu), all(eu %in% europe))
sets <- tibble(
label = c("All 142 countries", paste(length(europe), "European countries"),
"European Union, 21 of 27 members", "Euro area, 12 of 13 members"),
pop = c(sum(countries$pop), sum(countries$pop[countries$country %in% europe]),
sum(countries$pop[countries$country %in% eu]),
sum(countries$pop[countries$country %in% euro]))
) |>
mutate(r = sqrt(pop / 1e9 / pi),
people = ifelse(pop >= 1e9, sprintf("%.2f billion people", pop / 1e9),
sprintf("%.0f million people", pop / 1e6)))
stopifnot(!is.unsorted(rev(sets$pop), strictly = TRUE))
## The three inner sets are named on the right, each by a segment that ends
## in the middle of its ring (or of the inner disc).
R <- sets$r[1]
inner <- sets[-1, ] |>
mutate(r_mid = (r + c(r[-1], 0)) / 2,
angle = c(40, 0, -40) * pi / 180,
x = r_mid * cos(angle), y = r_mid * sin(angle),
xend = R + 0.25, yend = c(0.75, 0, -0.75))
p <- ggplot() +
geom_circle(data = sets, aes(x0 = 0, y0 = 0, r = r), colour = "#9b2367",
fill = "#9b2367", alpha = 0.14, linewidth = 0.4) +
annotate("text", x = 0, y = R * 0.68, size = 3, colour = "#535353", lineheight = 0.9,
label = paste0(sets$label[1], "\n", sets$people[1])) +
geom_segment(data = inner, aes(x = x, y = y, xend = xend, yend = yend),
colour = "#535353", linewidth = 0.3) +
geom_point(data = inner, aes(x = x, y = y), colour = "#535353", size = 0.6) +
geom_text(data = inner, aes(x = xend + 0.06, y = yend, label = paste0(label, "\n", people)),
hjust = 0, size = 2.8, colour = "#535353", lineheight = 0.9) +
coord_equal(xlim = c(-R - 0.05, R + 2.6), clip = "off") +
labs(title = "One person in twenty lived in the euro area in 2007",
subtitle = "Population of the 142 countries in the data; areas drawn to scale",
x = NULL, y = NULL,
caption = "Data: Gapminder, via the gapminder R package; membership on 1 January 2007") +
theme_lex_viz(grid = "", arrows = "") +
theme(axis.text = element_blank())Sources (1)
Cite this entry
Stable addresshttps://dataviz.adrientaudiere.com/en/term/onion-diagram.html
ReferenceTaudière Adrien. 2026. onion diagram. In Visualization Vocabulary, version 1.0.0. IdEst. https://dataviz.adrientaudiere.com/en/term/onion-diagram.html
BibTeX
@incollection{taudiere2026-onion-diagram,
  author    = {Taudière, Adrien},
  title     = {onion diagram},
  booktitle = {Visualization Vocabulary},
  year      = {2026},
  version   = {1.0.0},
  publisher = {IdEst},
  url       = {https://dataviz.adrientaudiere.com/en/term/onion-diagram.html},
  note      = {CC0 1.0}
}Page created on 2026-11-09. Text last changed on 2026-11-12. Images last changed on 2026-11-11. Numbers computed on 2026-10-22.