


 chart
radar chart
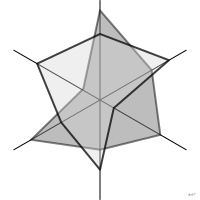
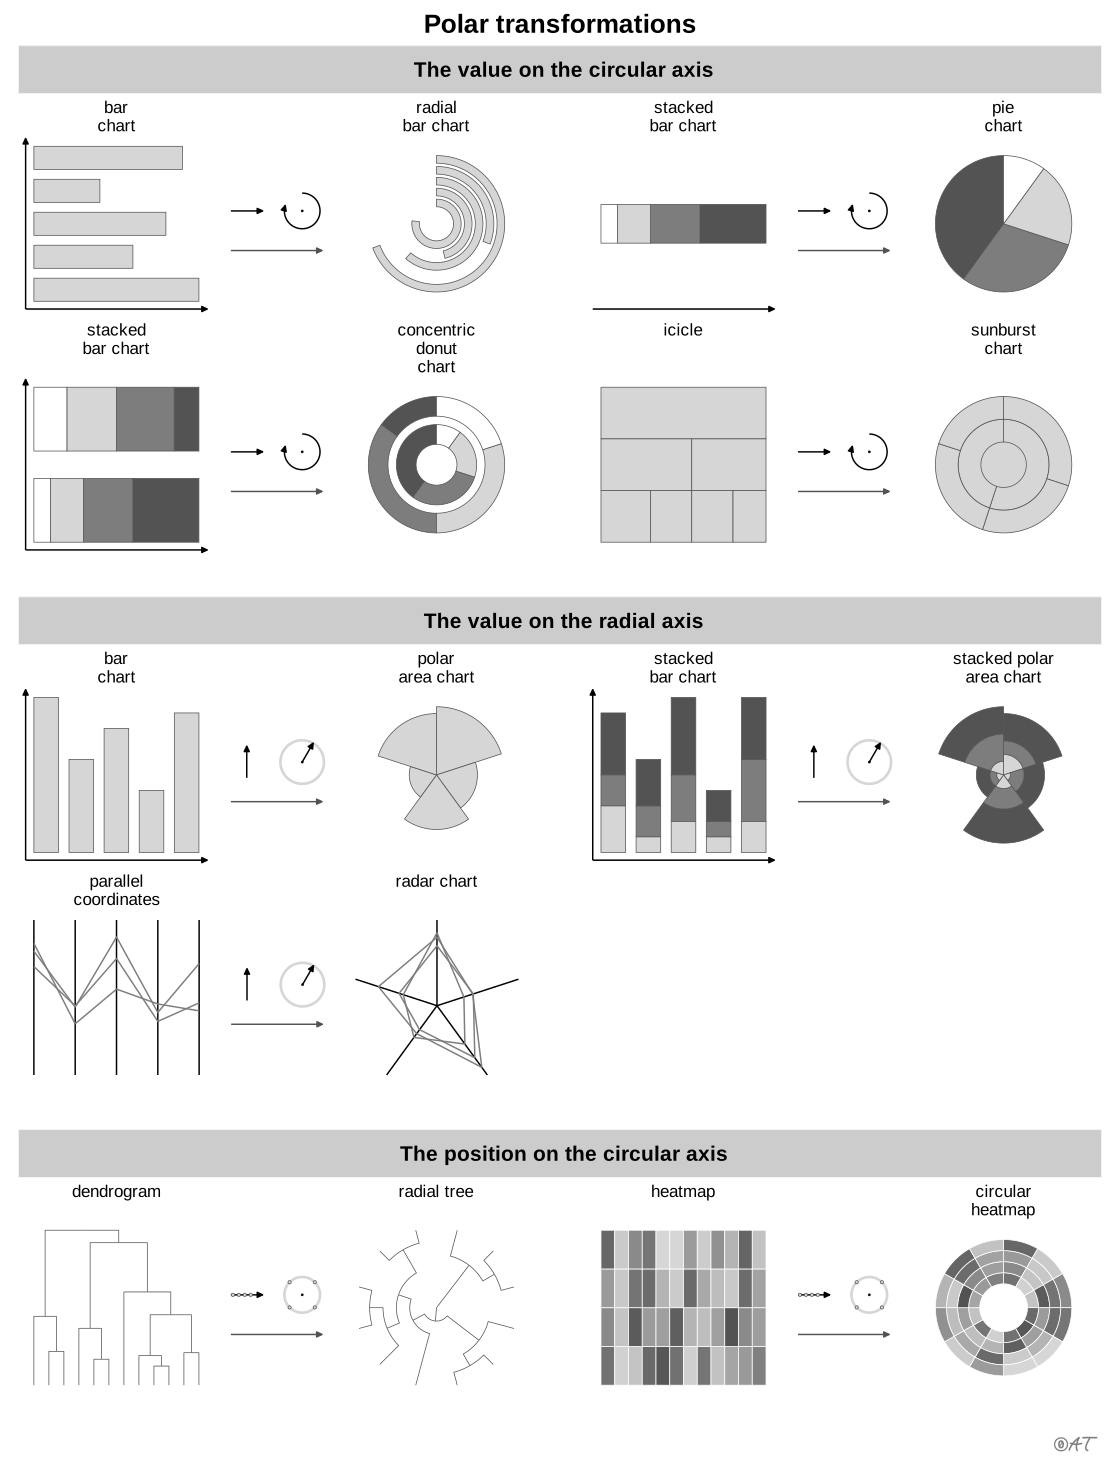
also: spider chart, star plotAxes radiating from a center joined into a polygon.
Classification
- chart
- radial › polar lines
- magnitude; Financial Times Visual Vocabulary
- the name evokes: nature, object
Channels
 position on unaligned scale; main: value on each axis
 area; secondary: overall profile (polygon area, which depends on the order of the axes)
 spatial region; main: variable (one direction per variable)
Attestation
- English definition: Data Visualisation Guide, data.europa.eu
Scientific literature
OpenAlex: 2 490 papers since 1956, 56% in the last five years; mostly in Engineering, Computer Science, Social Sciences; Wikidata
Seminal references
- first known use (1877) von Mayr (1877). Die Gesetzmässigkeit im Gesellschaftsleben; Ciuccarelli 2026, Friendly & Denis 2001
R code of the ggplot2 example
library(ggplot2)
library(dplyr)
library(tidyr)
library(palmerpenguins)
## Each measure rescaled from 0 to 1 over all the birds, then averaged by
## species: the spokes compare species without stretching their differences.
measures <- c(bill_length_mm = "Bill length", bill_depth_mm = "Bill depth",
flipper_length_mm = "Flipper length", body_mass_g = "Body mass")
means <- penguins |>
pivot_longer(all_of(names(measures)), names_to = "measure", values_to = "value") |>
filter(!is.na(value)) |>
group_by(measure) |>
mutate(value = (value - min(value)) / (max(value) - min(value))) |>
group_by(species, measure) |>
summarise(value = mean(value), .groups = "drop")
## Polygons drawn in plain x-y coordinates: one spoke per measure, clockwise from the top.
angle <- setNames(pi / 2 - 2 * pi * (seq_along(measures) - 1) / length(measures), names(measures))
polygons <- means |>
mutate(x = value * cos(angle[measure]), y = value * sin(angle[measure]))
rings <- expand_grid(r = c(0.25, 0.5, 0.75, 1), t = seq(0, 2 * pi, length.out = 121)) |>
mutate(x = r * cos(t), y = r * sin(t))
spokes <- tibble(measure = measures, x = cos(angle), y = sin(angle))
p <- ggplot(polygons, aes(x = x, y = y)) +
geom_path(data = rings, aes(group = r), colour = "#d6d6d6", linewidth = 0.3) +
geom_segment(data = spokes, aes(x = 0, y = 0, xend = x, yend = y), colour = "#d6d6d6", linewidth = 0.3) +
geom_text(data = spokes, aes(x = 1.12 * x, y = 1.12 * y, label = measure), size = 3, colour = "#535353") +
geom_polygon(aes(colour = species, fill = species), alpha = 0.12, linewidth = 0.7) +
annotate("text", x = c(1.6, 1.6, 1.6), y = c(-0.5, -0.7, -0.9),
label = c("Adelie", "Chinstrap", "Gentoo"), colour = c("#9b2367", "#2e7891", "#c06a1f"),
hjust = 0, size = 3.2) +
coord_fixed(xlim = c(-1.35, 2.25), ylim = c(-1.15, 1.15)) +
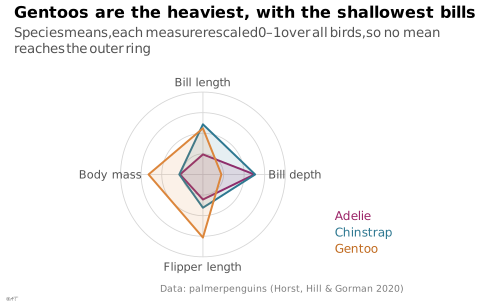
labs(title = "Gentoos are the heaviest, with the shallowest bills",
subtitle = "Species means, each measure rescaled 0–1 over all birds, so no mean reaches the outer ring",
x = NULL, y = NULL,
caption = "Data: palmerpenguins (Horst, Hill & Gorman 2020)") +
theme_lex_viz(grid = "", arrows = "") +
theme(legend.position = "none", axis.text = element_blank())Sources (24)
108 occurrences in the corpus; indexed by 11 books
Show the 24 sources
- app.flourish.studio
- Atlas of knowledge: anyone can map
- Better data visualizations: a guide for scholars, researchers, and wonks
- Data points: visualization that means something
- Data Visualisation Guide, data.europa.eu
- Data visualisation: a handbook for data driven design
- data-to-viz.com
- Effective data storytelling: how to drive change with data, narrative, and visuals
- Exploratory Data Analysis: Descriptive Analysis, Visualization, and Dashboard Design (w...
- From data to viz
- Interactive data visualization: foundations, techniques, and applications
- Milestones in the history of thematic cartography, statistical graphics, and data visua...
- Questions in Dataviz: A Design-Driven Process for Data Visualisation
- Show me the numbers: designing tables and graphs to enlighten
- The book of circles: visualizing spheres of knowledge
- The functional art: an introduction to information graphics and visualization
- The grammar of graphics
- The Truthful Art: Data, Charts, and Maps for Communication
- The Wall Street journal guide to information graphics: the dos and don'ts of presenting...
- Thematic Cartography and Geovisualization
- Visual strategies for biological data
- Visualization of Time-Oriented Data
- Wikipedia — Data and information visualization
- Wikipedia in English↗
Cite this entry
Stable addresshttps://dataviz.adrientaudiere.com/en-only/term/radar-chart.html
ReferenceTaudière Adrien. 2026. radar chart. In Visualization Vocabulary, version 1.0.0. IdEst. https://dataviz.adrientaudiere.com/en-only/term/radar-chart.html
BibTeX
@incollection{taudiere2026-radar-chart,
  author    = {Taudière, Adrien},
  title     = {radar chart},
  booktitle = {Visualization Vocabulary},
  year      = {2026},
  version   = {1.0.0},
  publisher = {IdEst},
  url       = {https://dataviz.adrientaudiere.com/en-only/term/radar-chart.html},
  note      = {CC0 1.0}
}Page created on 2026-10-13. Text last changed on 2026-11-06. Images last changed on 2026-11-12. Numbers computed on 2026-10-22.