
 chart
sunburst
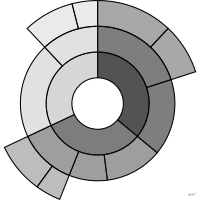
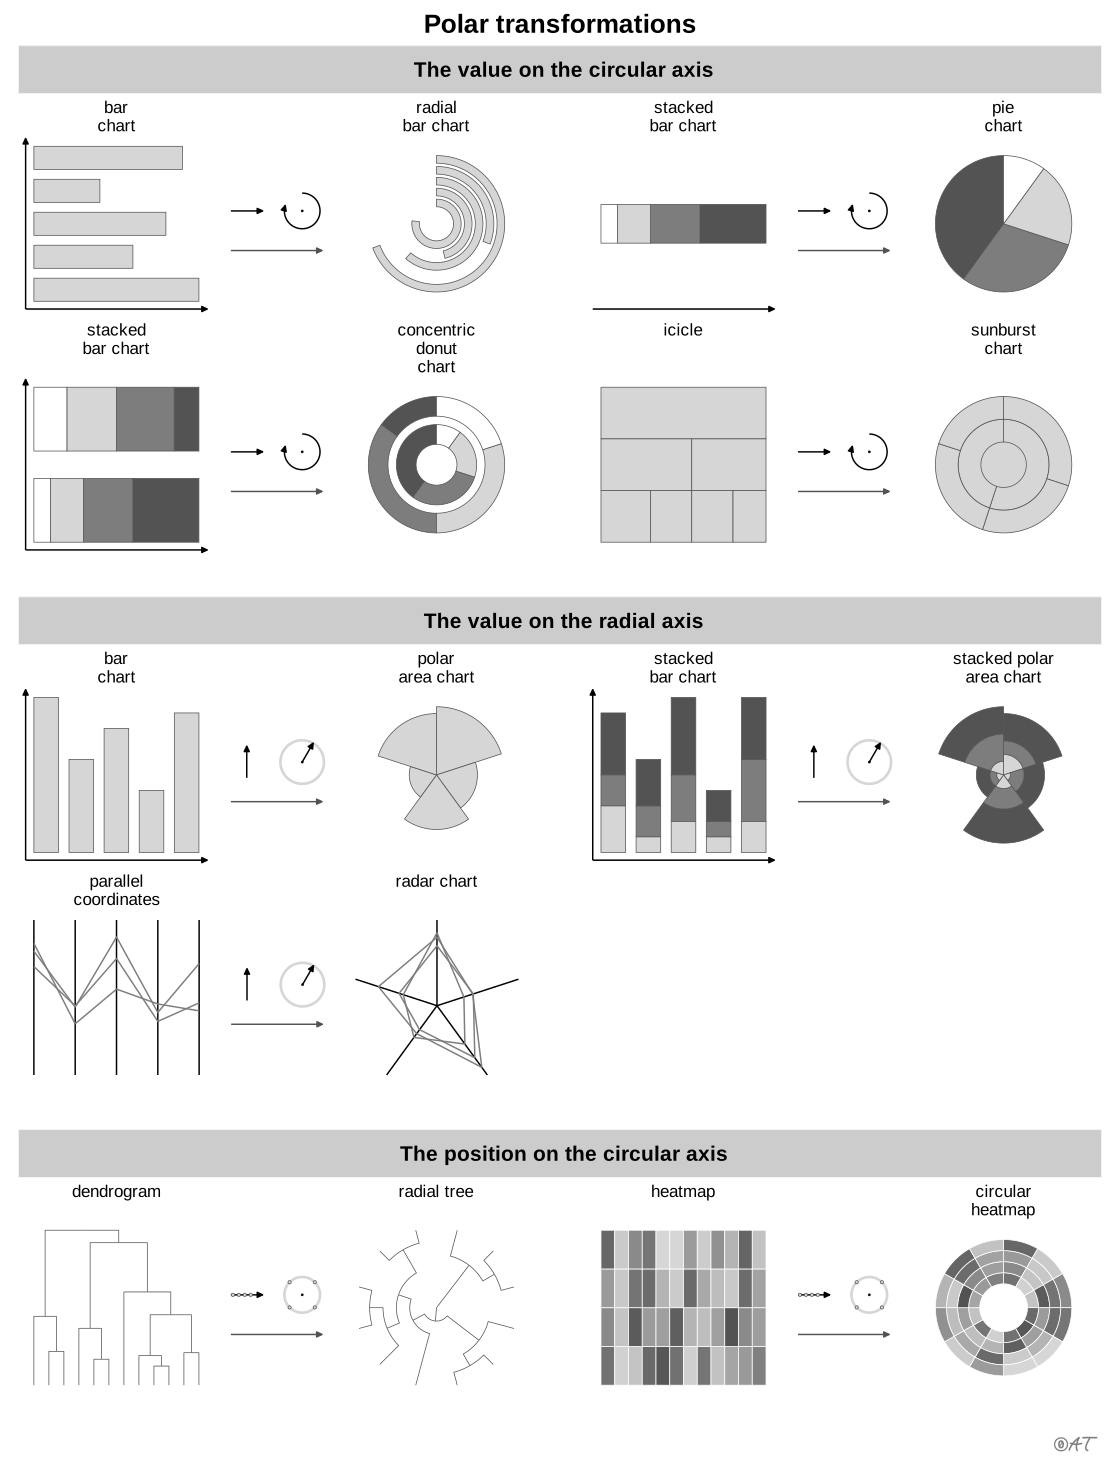
also: radial treemap, sunburst chartHierarchy shown as subdivided concentric rings.
Classification
- chart
- sectors, tilings and units › sectors
- part-to-whole
- the name evokes: nature
Channels
 tilt/angle; main: value (share of the parent)
 area; main: value (share of the total)
 spatial region; main: hierarchical level (rings)
 color hue; secondary: branch
Attestation
- English definition: Data Visualisation Guide, data.europa.eu
Scientific literature
OpenAlex: 173 papers since 1992, 35% in the last five years; mostly in Computer Science; Wikidata
Seminal references
R packages
- R
sunburstR::sunburst(); GitHub 217 stars; last commit 2023-02 - R
WeightedTreemaps::sunburstTreemap(); GitHub 57 stars; last commit 2024-12; paper (3 citations)
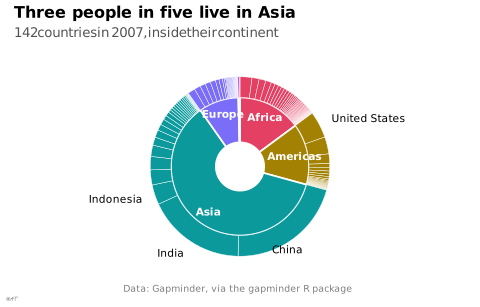
R code of the ggplot2 example
library(ggplot2)
library(dplyr)
library(gapminder)
## Each country takes its share of the turn, continent by continent, largest
## first; each continent spans its countries.
countries <- gapminder |>
filter(year == 2007) |>
arrange(continent, desc(pop)) |>
mutate(end = cumsum(as.numeric(pop)),
start = lag(end, default = 0),
middle = (start + end) / 2)
continents <- countries |>
group_by(continent) |>
summarise(start = min(start), end = max(end), middle = (start + end) / 2)
## Inner ring: continents; outer ring: countries. Countries of over 200
## million people are named outside the circle.
p <- ggplot() +
geom_rect(data = continents, aes(xmin = 0.7, xmax = 2, ymin = start, ymax = end, fill = continent),
colour = "white", linewidth = 0.6) +
geom_rect(data = countries, aes(xmin = 2, xmax = 2.6, ymin = start, ymax = end, fill = continent),
colour = "white", linewidth = 0.15) +
geom_text(data = filter(continents, continent != "Oceania"), aes(x = 1.6, y = middle, label = continent),
colour = "white", fontface = "bold", size = 2.8) +
geom_text(data = filter(countries, pop > 2e8),
aes(x = 3, y = middle, label = country, hjust = ifelse(middle < max(end) / 2, 0, 1)),
size = 2.8) +
scale_x_continuous(limits = c(0, 2.6), oob = scales::oob_keep) +
scale_fill_manual(values = continent_colors) +
coord_radial(theta = "y", expand = FALSE, clip = "off") +
labs(title = "Three people in five live in Asia",
subtitle = "142 countries in 2007, inside their continent",
x = NULL, y = NULL,
caption = "Data: Gapminder, via the gapminder R package") +
theme_lex_viz(grid = "", arrows = "") +
theme(legend.position = "none", axis.text = element_blank())Sources (18)
119 occurrences in the corpus; indexed by 4 books
Show the 18 sources
- app.flourish.studio
- Better data visualizations: a guide for scholars, researchers, and wonks
- Data Visualisation Guide, data.europa.eu
- Data visualisation: a handbook for data driven design
- Data Viz Project
- data-to-viz.com
- datavizcatalogue.com
- datavizproject.com
- Design for information: an introduction to the histories, theories, and best practices ...
- Effective data visualization: the right chart for the right data
- Exploratory Data Analysis: Descriptive Analysis, Visualization, and Dashboard Design (w...
- Focus+context display and navigation techniques for enhancing radial, space-filling hie...
- From data to viz
- Interactive data visualization: foundations, techniques, and applications
- The book of circles: visualizing spheres of knowledge
- The book of trees: visualizing branches of knowledge
- Visualizing with text
- Wikipedia in English↗
Cite this entry
Stable addresshttps://dataviz.adrientaudiere.com/en-only/term/sunburst.html
ReferenceTaudière Adrien. 2026. sunburst. In Visualization Vocabulary, version 1.0.0. IdEst. https://dataviz.adrientaudiere.com/en-only/term/sunburst.html
BibTeX
@incollection{taudiere2026-sunburst,
  author    = {Taudière, Adrien},
  title     = {sunburst},
  booktitle = {Visualization Vocabulary},
  year      = {2026},
  version   = {1.0.0},
  publisher = {IdEst},
  url       = {https://dataviz.adrientaudiere.com/en-only/term/sunburst.html},
  note      = {CC0 1.0}
}Page created on 2026-10-13. Text last changed on 2026-11-12. Images last changed on 2026-11-11. Numbers computed on 2026-10-22.