
 graphique
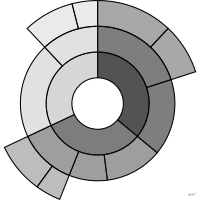
diagramme en rayons de soleil
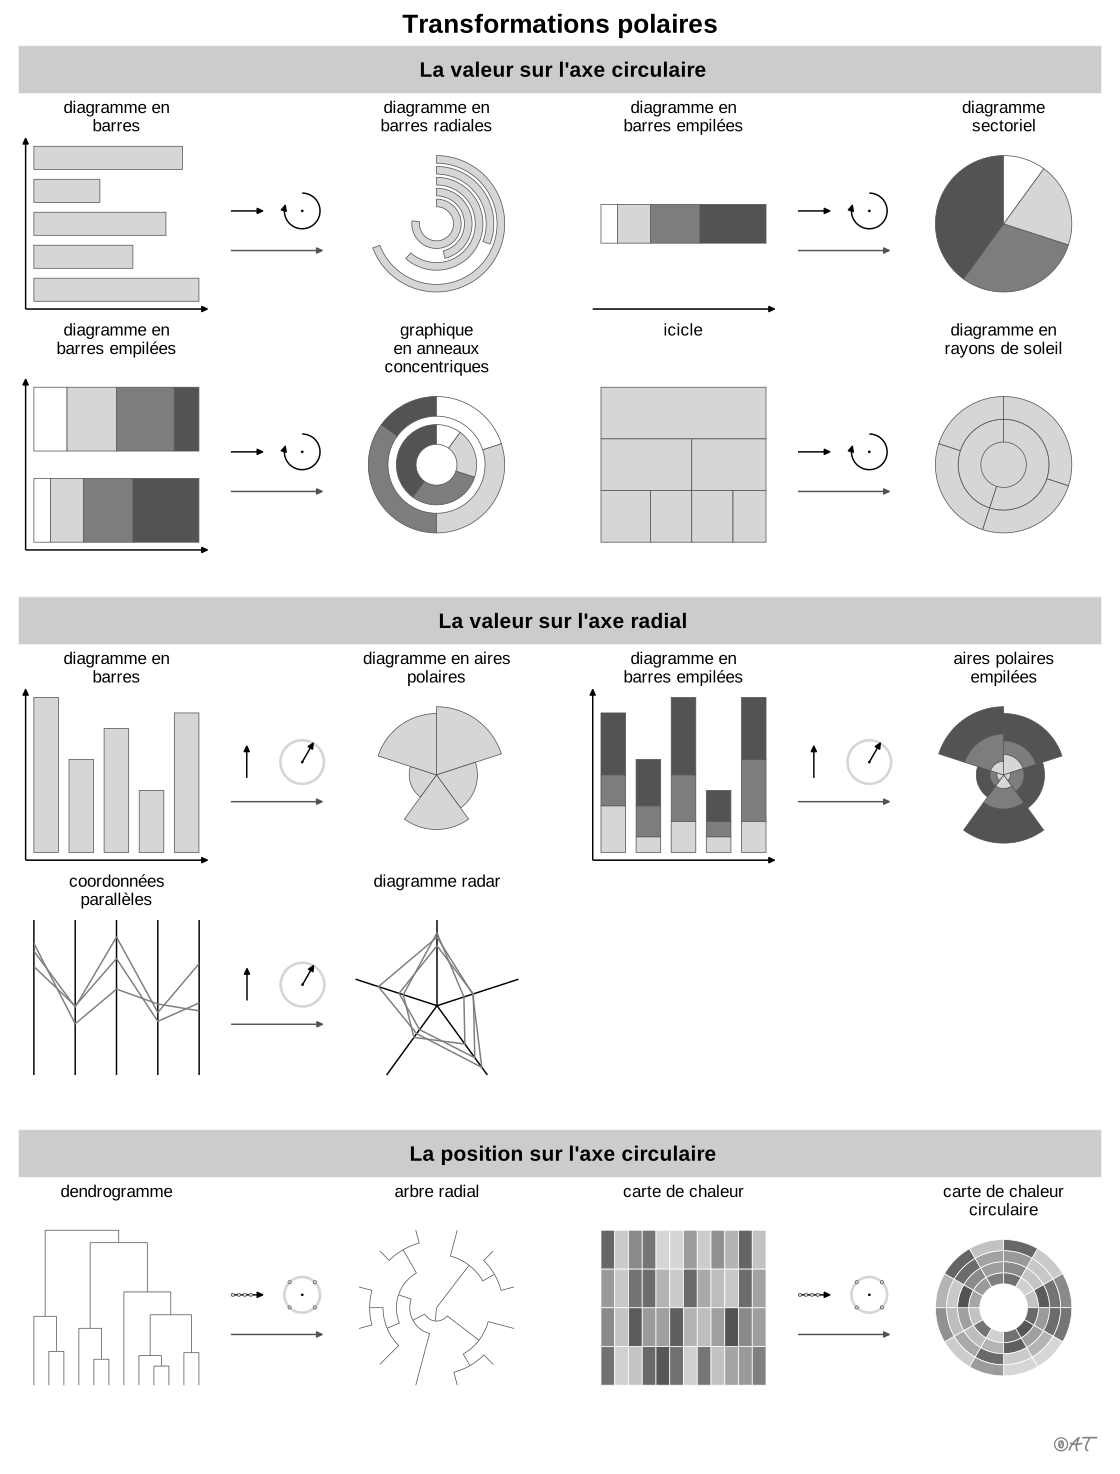
aussi : graphique en anneauxHiérarchie représentée par des anneaux concentriques subdivisés.
sunburst
also: radial treemap, sunburst chartHierarchy shown as subdivided concentric rings.
Lagnel emploie « graphique en anneaux » pour sunburst.
Classification
- graphique
- secteurs, pavages et unités › secteurs
- partie d'un tout
- le nom évoque : nature, objet
Canaux
 inclinaison ou angle; principal : valeur (part dans le parent)
 aire; principal : valeur (part dans le total)
 région de l'espace; principal : niveau hiérarchique (anneaux)
 teinte; secondaire : branche
Attestation et synonymies
- terme français : Lagnel, Manuel de datavisualisation, Dunod, 2021
- définition anglaise : Data Visualisation Guide, data.europa.eu
- graphique en anneaux; Lagnel, Manuel de datavisualisation, Dunod, 2021
Littérature scientifique
OpenAlex : 173 articles depuis 1992, dont 35 % ces cinq dernières années; surtout en Computer Science; Wikidata
Références séminales
Paquets R
- R
sunburstR::sunburst(); GitHub 217 étoiles; dernier commit 2023-02 - R
WeightedTreemaps::sunburstTreemap(); GitHub 57 étoiles; dernier commit 2024-12; article (3 citations)
Code R de l'exemple ggplot2
library(ggplot2)
library(dplyr)
library(gapminder)
## Each country takes its share of the turn, continent by continent, largest
## first; each continent spans its countries.
countries <- gapminder |>
filter(year == 2007) |>
arrange(continent, desc(pop)) |>
mutate(end = cumsum(as.numeric(pop)),
start = lag(end, default = 0),
middle = (start + end) / 2)
continents <- countries |>
group_by(continent) |>
summarise(start = min(start), end = max(end), middle = (start + end) / 2)
## Inner ring: continents; outer ring: countries. Countries of over 200
## million people are named outside the circle.
p <- ggplot() +
geom_rect(data = continents, aes(xmin = 0.7, xmax = 2, ymin = start, ymax = end, fill = continent),
colour = "white", linewidth = 0.6) +
geom_rect(data = countries, aes(xmin = 2, xmax = 2.6, ymin = start, ymax = end, fill = continent),
colour = "white", linewidth = 0.15) +
geom_text(data = filter(continents, continent != "Oceania"), aes(x = 1.6, y = middle, label = continent),
colour = "white", fontface = "bold", size = 2.8) +
geom_text(data = filter(countries, pop > 2e8),
aes(x = 3, y = middle, label = country, hjust = ifelse(middle < max(end) / 2, 0, 1)),
size = 2.8) +
scale_x_continuous(limits = c(0, 2.6), oob = scales::oob_keep) +
scale_fill_manual(values = continent_colors) +
coord_radial(theta = "y", expand = FALSE, clip = "off") +
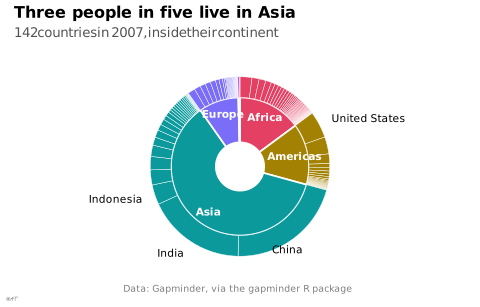
labs(title = "Three people in five live in Asia",
subtitle = "142 countries in 2007, inside their continent",
x = NULL, y = NULL,
caption = "Data: Gapminder, via the gapminder R package") +
theme_lex_viz(grid = "", arrows = "") +
theme(legend.position = "none", axis.text = element_blank())Sources (21)
119 occurrences dans le corpus; indexé par 4 ouvrages
Afficher les 21 sources
- app.flourish.studio
- Better data visualizations: a guide for scholars, researchers, and wonks
- Data Visualisation Guide, data.europa.eu
- Data visualisation: a handbook for data driven design
- Data Viz Project
- data-to-viz.com
- datavizcatalogue.com
- datavizproject.com
- Design for information: an introduction to the histories, theories, and best practices ...
- Effective data visualization: the right chart for the right data
- Exploratory Data Analysis: Descriptive Analysis, Visualization, and Dashboard Design (w...
- Focus+context display and navigation techniques for enhancing radial, space-filling hie...
- From data to viz
- Interactive data visualization: foundations, techniques, and applications
- Lagnel, Manuel de datavisualisation, Dunod, 2021
- Les fondamentaux de la visualisation de données
- Manuel de datavisualisation - 2e éd, vol. 2
- The book of circles: visualizing spheres of knowledge
- The book of trees: visualizing branches of knowledge
- Visualizing with text
- Wikipedia in English↗
Citer cette fiche
Adresse stablehttps://dataviz.adrientaudiere.com/terme/sunburst.html
RéférenceTaudière Adrien. 2026. diagramme en rayons de soleil. Dans Visualization Vocabulary, version 1.0.0. IdEst. https://dataviz.adrientaudiere.com/terme/sunburst.html
BibTeX
@incollection{taudiere2026-sunburst,
  author    = {Taudière, Adrien},
  title     = {diagramme en rayons de soleil},
  booktitle = {Visualization Vocabulary},
  year      = {2026},
  version   = {1.0.0},
  publisher = {IdEst},
  url       = {https://dataviz.adrientaudiere.com/terme/sunburst.html},
  note      = {CC0 1.0}
}Fiche créée le 13/10/2026. Texte modifié le 12/11/2026. Images modifiées le 11/11/2026. Chiffres calculés le 22/10/2026.