

 chart
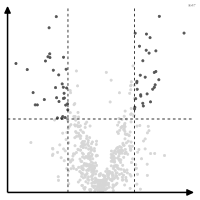
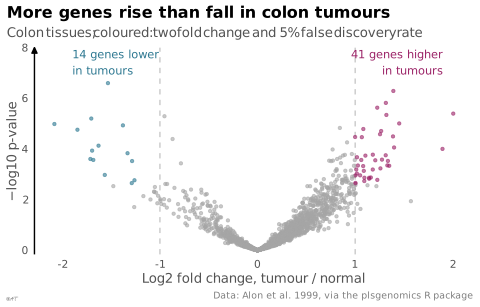
volcano plot
Effect size against significance in high-throughput analysis.
Classification
- chart
- points and bubbles › scatterplots
- correlation
- the name evokes: nature
Channels
 position on common scale; main: effect and −log10 p
 spatial region; secondary: significance
 color hue; secondary: significance
Scientific literature
OpenAlex: 3 486 papers since 1979, 72% in the last five years; mostly in Medicine, Biochemistry, Genetics and Molecular Biology, Energy
Seminal references
- first known use (2003) Cui & Churchill (2003). Statistical tests for differential expression in cDNA microarray experiments. Genome Biology (908 citations)
R packages
R code of the ggplot2 example
library(ggplot2)
library(plsgenomics)
## 2 000 genes in 40 colon tumours and 22 normal tissues: log2 fold change of
## the means and Welch t-test, p-values adjusted by Benjamini-Hochberg.
data(Colon)
expression <- log2(Colon$X)
tumour <- Colon$Y == 2
genes <- data.frame(
change = colMeans(expression[tumour, ]) - colMeans(expression[!tumour, ]),
p = apply(expression, 2, \(g) t.test(g[tumour], g[!tumour])$p.value)
)
genes$q <- p.adjust(genes$p, method = "BH")
genes$group <- with(genes, ifelse(q < 0.05 & change > 1, "Higher in tumours",
ifelse(q < 0.05 & change < -1, "Lower in tumours", "Other")))
counts <- table(genes$group)
p <- ggplot(genes, aes(x = change, y = -log10(p), colour = group)) +
geom_vline(xintercept = c(-1, 1), colour = "#a6a6a6", linewidth = 0.3, linetype = "dashed") +
geom_point(size = 0.9, alpha = 0.6) +
annotate("text", x = c(1.9, -1.9), y = 7.9, hjust = c(1, 0), vjust = 1, size = 3, colour = c("#9b2367", "#2e7891"),
label = paste(counts[c("Higher in tumours", "Lower in tumours")],
c("genes higher\nin tumours", "genes lower\nin tumours"))) +
scale_colour_manual(values = c(`Higher in tumours` = "#9b2367", `Lower in tumours` = "#2e7891",
Other = "#a6a6a6")) +
scale_x_continuous(labels = lex_number) +
scale_y_continuous(labels = lex_number, limits = c(0, 8), expand = expansion(mult = c(0.02, 0))) +
labs(title = "More genes rise than fall in colon tumours",
subtitle = "Colon tissues; coloured: twofold change and 5% false discovery rate",
x = "Log2 fold change, tumour / normal", y = "−log10 p-value",
caption = "Data: Alon et al. 1999, via the plsgenomics R package") +
theme_lex_viz(grid = "", arrows = "y") +
theme(legend.position = "none")Sources (1)
Cite this entry
Stable addresshttps://dataviz.adrientaudiere.com/en-only/term/volcano-plot.html
ReferenceTaudière Adrien. 2026. volcano plot. In Visualization Vocabulary, version 1.0.0. IdEst. https://dataviz.adrientaudiere.com/en-only/term/volcano-plot.html
BibTeX
@incollection{taudiere2026-volcano-plot,
  author    = {Taudière, Adrien},
  title     = {volcano plot},
  booktitle = {Visualization Vocabulary},
  year      = {2026},
  version   = {1.0.0},
  publisher = {IdEst},
  url       = {https://dataviz.adrientaudiere.com/en-only/term/volcano-plot.html},
  note      = {CC0 1.0}
}Page created on 2026-10-13. Text last changed on 2026-11-02. Images last changed on 2026-11-02. Numbers computed on 2026-10-22.