
 chart
alluvial diagram
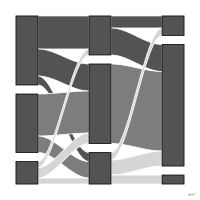
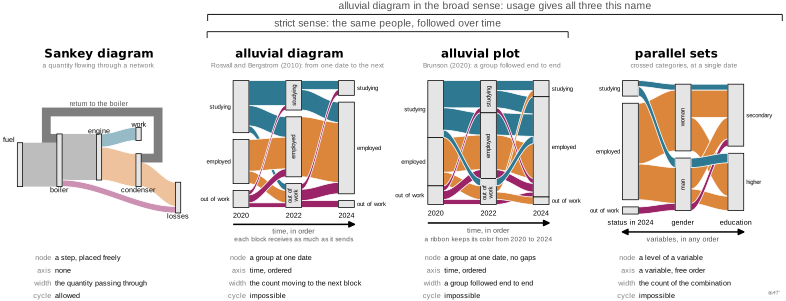
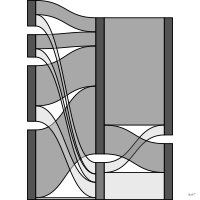
Blocks stacked at each stage of an ordered sequence, linked from one stage to the next by bands whose width encodes the count moving from one group to another.
diagramme alluvial
Blocs empilés à chaque étape d'une suite ordonnée, reliés d'une étape à la suivante par des bandes dont l'épaisseur code l'effectif qui passe d'un groupe à l'autre.
Introduit par Rosvall et Bergstrom (2010) pour le changement de structure d'un réseau : les blocs y sont espacés et chaque bande ne relie que deux étapes voisines, si bien qu'un bloc reçoit autant qu'il émet. Au sens large, le terme inclut les ensembles parallèles et le graphique alluvial de Brunson (2020), qui suit un même groupe de bout en bout. Plusieurs sources en font une forme du diagramme de Sankey.
Classification
- chart
- flows › ribbon flows
- flow, change over time
- the name evokes: nature
Channels
 length; main: count of each group and each flow
 area; secondary: count of each group and each flow
 spatial region; main: date and group
 color hue; secondary: starting group of the flow
Variants
 alluvial plotend-to-end ribbons
 parallel setsunordered categorical variables
Attestation and synonyms
- French term: Larmarange, guide-R: analysing survey data with R
- English definition: Rosvall & Bergstrom, Mapping Change in Large Networks, PLoS ONE, 2010↗
- alluvial graph; Atlas of knowledge: anyone can map
Seminal references
- naming (2010) Rosvall & Bergstrom (2010). Mapping change in large networks. PLoS ONE (650 citations); Ciuccarelli 2026
R packages
- R
ggalluvial::geom_flow(); GitHub 526 stars; last commit 2026-02; paper (536 citations) - R
alluvial::alluvial(); GitHub 147 stars; last commit 2026-05; paper (33 citations)
R code of the ggplot2 example
library(ggplot2)
library(dplyr)
library(tidyr)
library(ggalluvial)
library(gapminder)
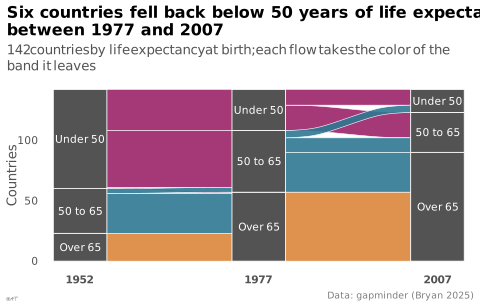
## Countries by life-expectancy band in 1952, 1977 and 2007. As in Rosvall &
## Bergstrom (2010), flows only join adjacent dates (geom_flow): each flow
## takes the color of the band it leaves, and a band receives as much as it
## sends.
bands <- gapminder |>
filter(year %in% c(1952, 1977, 2007)) |>
mutate(band = cut(lifeExp, c(0, 50, 65, Inf), right = FALSE,
labels = c("Under 50", "50 to 65", "Over 65"))) |>
select(country, year, band)
p <- ggplot(bands, aes(x = factor(year), stratum = band, alluvium = country)) +
geom_flow(aes(fill = band), aes.flow = "forward", width = 0.3, colour = "white",
linewidth = 0.2, alpha = 0.9) +
geom_stratum(width = 0.3, fill = "#535353", colour = "white", linewidth = 0.3) +
geom_text(stat = "stratum", aes(label = after_stat(stratum)), colour = "white", size = 2.8) +
scale_fill_manual(values = unname(lex_colors)) +
scale_x_discrete(expand = expansion(add = 0.2)) +
labs(title = "Six countries fell back below 50 years of life expectancy\nbetween 1977 and 2007",
subtitle = "142 countries by life expectancy at birth; each flow takes the color\nof the band it leaves",
x = NULL, y = "Countries",
caption = "Data: gapminder (Bryan 2025)") +
theme_lex_viz(grid = "", arrows = "") +
theme(legend.position = "none", axis.text.x = element_text(face = "bold"))Sources (8)
36 occurrences in the corpus; indexed by 1 book
- Bremer & Barone, Chart, CRC Press, 2025
- Data visualisation: a handbook for data driven design
- Design for information: an introduction to the histories, theories, and best practices ...
- Larmarange, guide-R: analysing survey data with R
- Rosvall & Bergstrom, Mapping Change in Large Networks, PLoS ONE, 2010↗
- The art of insight: how great visualization designers think
- Visualization of Time-Oriented Data
- Visualize This
Cite this entry
Stable addresshttps://dataviz.adrientaudiere.com/en/term/alluvial-diagram.html
ReferenceTaudière Adrien. 2026. alluvial diagram. In Visualization Vocabulary, version 1.0.0. IdEst. https://dataviz.adrientaudiere.com/en/term/alluvial-diagram.html
BibTeX
@incollection{taudiere2026-alluvial-diagram,
  author    = {Taudière, Adrien},
  title     = {alluvial diagram},
  booktitle = {Visualization Vocabulary},
  year      = {2026},
  version   = {1.0.0},
  publisher = {IdEst},
  url       = {https://dataviz.adrientaudiere.com/en/term/alluvial-diagram.html},
  note      = {CC0 1.0}
}Page created on 2026-11-10. Text last changed on 2026-11-12. Images last changed on 2026-11-11. Numbers computed on 2026-10-22.