
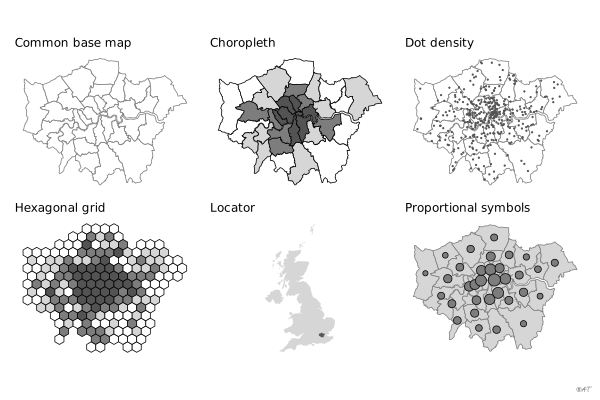
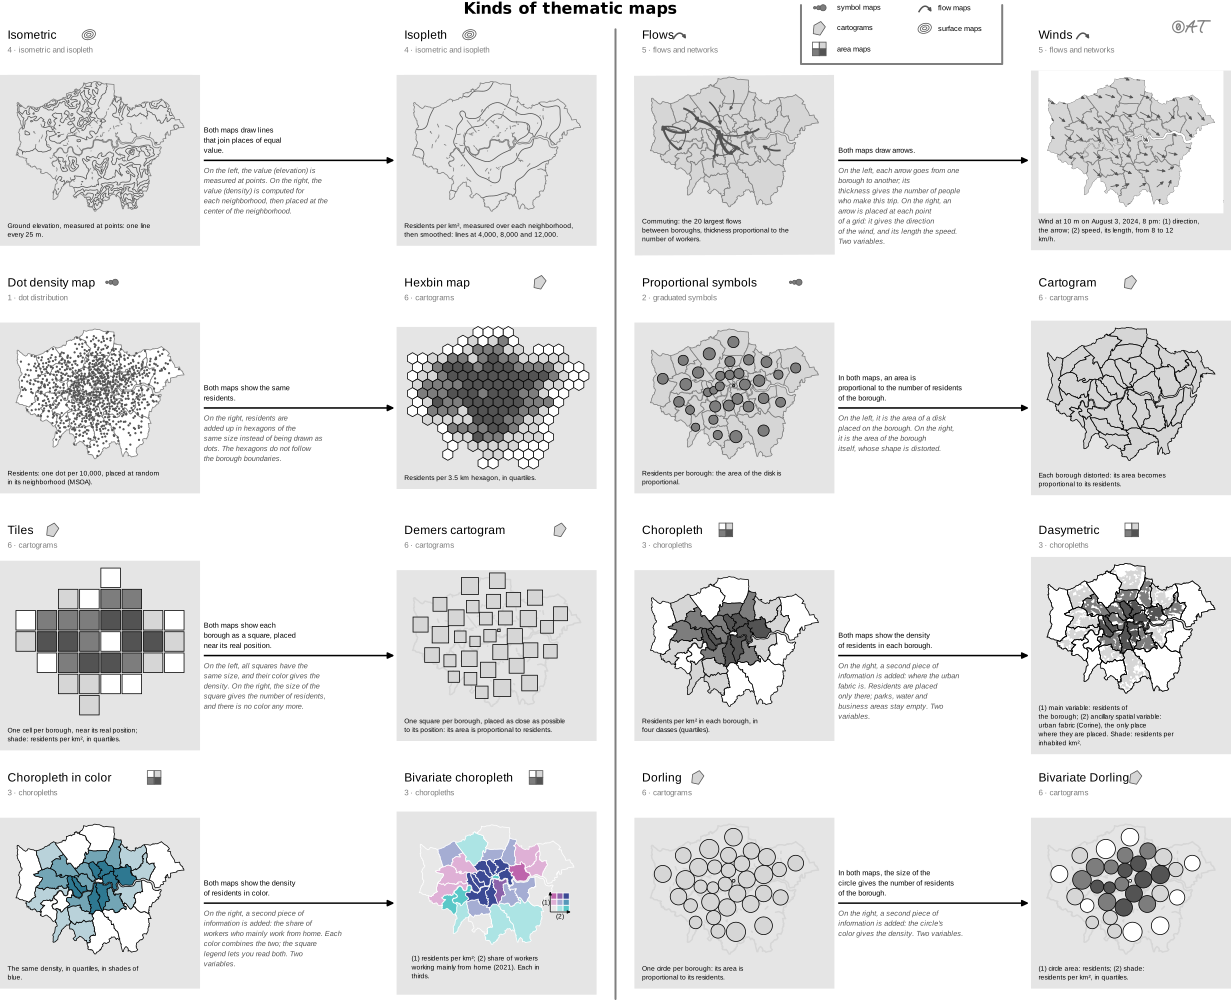

 map
choropleth map
also: statistical map, crosshatched mapMap whose areas are colored by a relative value.
carte choroplèthe
Carte dont les unités sont colorées selon une valeur relative.
Réserver aux taux et densités jamais aux effectifs bruts.
Classification
- map
- maps › area maps
- spatial; Financial Times Visual Vocabulary
Variants
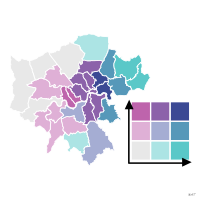 bivariate maptwo variables
- dasymetric mapzones redrawn from land use
Attestation and synonyms
- French term: Lagnel, Manuel de datavisualisation, Dunod, 2021
- English definition: Brinton, Graphic Presentation, 1939↗
- statistical map; Brinton, Graphic Presentation, 1939↗
- crosshatched map; Brinton, Graphic Presentation, 1939↗
Scientific literature
OpenAlex: 1 726 papers since 1967, 45% in the last five years; mostly in Social Sciences, Medicine, Computer Science; Wikidata
Seminal references
- first known use (1826) Dupin (1826). Carte figurative de l'instruction populaire de la France; Friendly & Denis 2001, Ciuccarelli 2026
- naming (1938) Wright (1938). Notes on Statistical Mapping, with Special Reference to the Mapping of Population Phenomena. American Geographical Society; Ciuccarelli 2026
R packages
- R
ggplot2::geom_sf(); tutorial; GitHub 7 025 stars; last commit 2026-10; paper (33 455 citations) - R
mapsf::mf_map(); GitHub 249 stars; last commit 2026-10 Avec type = "choro".
Sources (57)
652 occurrences in the corpus; indexed by 19 books
Show the 57 sources
- Atlas of knowledge: anyone can map
- Audric, de Bellefon & Durieux, « Analyse spatiale descriptive », Manuel d'analyse spatiale (Insee Méthodes n° 131), 2018
- Beautiful evidence
- Better data visualizations: a guide for scholars, researchers, and wonks
- blog.datawrapper.de↗
- Brinton, Graphic Presentation, 1939↗
- Cartography: thematic map design
- Data Feminism
- Data points: visualization that means something
- Data Visualisation Guide, data.europa.eu
- Data visualisation: a handbook for data driven design
- Data visualization handbook
- Data visualization: a practical introduction
- Data Viz Project
- Data-driven storytelling
- data-to-viz.com
- datavizcatalogue.com
- datavizproject.com
- datawrapper.de↗
- Design for information: an introduction to the histories, theories, and best practices ...
- Effective data visualization: the right chart for the right data
- Envisioning information
- Exploratory Data Analysis: Descriptive Analysis, Visualization, and Dashboard Design (w...
- French Wikipedia↗
- French Wikipedia — Visualisation de données
- Friendly & Wainer, A History of Data Visualization and Graphic Communication, Harvard University Press, 2021
- From data to viz
- Giraud & Pecout, Géomatique et cartographie avec R
- Graphic presentation
- Graphical Perception: Theory, Experimentation, and Application to the Development of Gr...
- Handling and mapping geographic information
- How maps work: representation, visualization, and design
- Information Graphics: A Comprehensive Illustrated Reference
- Interactive data visualization: foundations, techniques, and applications
- Lagnel, Manuel de datavisualisation, Dunod, 2021
- Les fondamentaux de la visualisation de données
- Magrit user manual, French version (UAR RIATE, CNRS)
- Manuel de datavisualisation - 2e éd, vol. 2
- Milestones in the history of thematic cartography, statistical graphics, and data visua...
- Open Visualization Academy, courses and newsletter (Cairo et al.)
- Practical charts: the essential guide to creating clear, compelling charts for reports ...
- Show me the numbers: designing tables and graphs to enlighten
- The art of insight: how great visualization designers think
- The big book of dashboards: visualizing your data using real-world business scenarios
- The elements of graphing data
- The functional art: an introduction to information graphics and visualization
- The golden age of data visualization: how did we get here?
- The grammar of graphics
- The Minard System: The Complete Statistical Graphics of Charles-Joseph Minard
- The Truthful Art: Data, Charts, and Maps for Communication
- Thematic Cartography and Geovisualization
- Visualization Analysis and Design
- Visualization of Time-Oriented Data
- Visualize This
- Visualizing with text
- Wikipedia in English↗
- Wilke, Fundamentals of Data Visualization, O'Reilly, 2019
Cite this entry
Stable addresshttps://dataviz.adrientaudiere.com/en/term/choropleth-map.html
ReferenceTaudière Adrien. 2026. choropleth map. In Visualization Vocabulary, version 1.0.0. IdEst. https://dataviz.adrientaudiere.com/en/term/choropleth-map.html
BibTeX
@incollection{taudiere2026-choropleth-map,
  author    = {Taudière, Adrien},
  title     = {choropleth map},
  booktitle = {Visualization Vocabulary},
  year      = {2026},
  version   = {1.0.0},
  publisher = {IdEst},
  url       = {https://dataviz.adrientaudiere.com/en/term/choropleth-map.html},
  note      = {CC0 1.0}
}Page created on 2026-10-13. Text last changed on 2026-11-10. Images last changed on 2026-11-10. Numbers computed on 2026-10-22.