
 chart
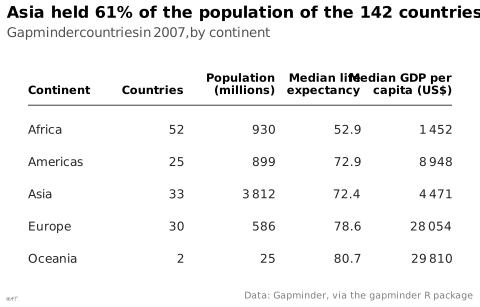
data table
also: tablePresentation of exact values in rows and columns.
tableau de données
Présentation des valeurs exactes en lignes et colonnes.
Souvent préférable au graphique sous une vingtaine de valeurs.
Examples
See the figure at Lu Guan, Weiying Shi, Qianqian Li, Jeffry Oktavianus, Mengmeng Wu ↗
See the figure at Andrey Sitnik, Travis Turner (Evil Martians) ↗
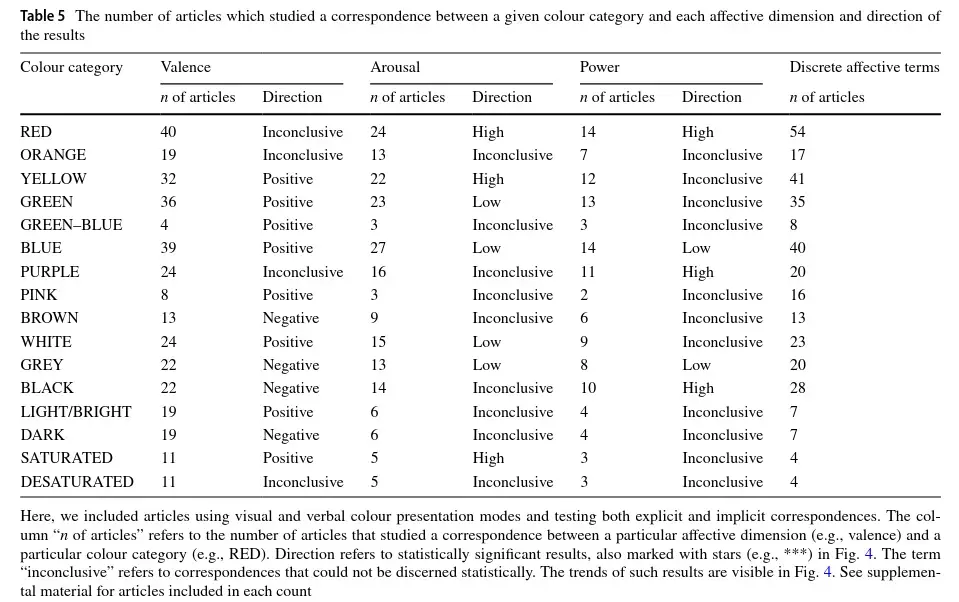
See the figure at Tugba Kulahcioglu, Gerard de Melo ↗
See the figure at Matthew Brehmer, Tamara Munzner ↗
See the figure at Katy Börner, Andreas Bueckle, Michael Ginda ↗
Classification
- chart
- matrices and tables › tables
Channels
 color luminance; secondary: highlighting
 color saturation; secondary: highlighting (instead of luminance)
 spatial region; main: row and column (the values are written, not encoded)
Attestation
- French term: Lagnel, Manuel de datavisualisation, Dunod, 2021
- English definition: Data Visualisation Guide, data.europa.eu
R packages
- R
gt::gt(); GitHub 2 162 stars; last commit 2026-10 - R
formattable::formattable(); GitHub 700 stars; last commit 2026-10
R code of the ggplot2 example
library(ggplot2)
library(dplyr)
library(gapminder)
## A table drawn with ggplot2: one text per cell, numbers right-aligned on
## the right edge of their column, a rule under the header.
rows <- gapminder |>
filter(year == 2007) |>
group_by(continent) |>
summarise(countries = n(), pop = sum(as.numeric(pop)) / 1e6,
life = median(lifeExp), gdp = median(gdpPercap)) |>
mutate(row = rev(seq_along(continent)))
columns <- tibble(x = c(0, 2.9, 4.6, 6.2, 7.9), hjust = c(0, 1, 1, 1, 1),
header = c("Continent", "Countries", "Population\n(millions)",
"Median life\nexpectancy", "Median GDP per\ncapita (US$)"))
cells <- bind_rows(
tibble(col = 1, label = as.character(rows$continent), row = rows$row),
tibble(col = 2, label = as.character(rows$countries), row = rows$row),
tibble(col = 3, label = lex_number(round(rows$pop)), row = rows$row),
tibble(col = 4, label = sprintf("%.1f", rows$life), row = rows$row),
tibble(col = 5, label = lex_number(round(rows$gdp)), row = rows$row)
) |>
mutate(x = columns$x[col], hjust = columns$hjust[col])
p <- ggplot() +
geom_text(data = columns, aes(x = x, y = 6.1, label = header, hjust = hjust),
vjust = 0, fontface = "bold", colour = "black", size = 3, lineheight = 0.9) +
annotate("segment", x = 0, xend = 7.9, y = 5.75, yend = 5.75, colour = "#535353", linewidth = 0.4) +
geom_text(data = cells, aes(x = x, y = row, label = label, hjust = hjust),
colour = "#262626", size = 3.2) +
scale_y_continuous(limits = c(0.5, 7.2)) +
labs(title = "Asia held 61% of the population of the 142 countries",
subtitle = "Gapminder countries in 2007, by continent",
x = NULL, y = NULL,
caption = "Data: Gapminder, via the gapminder R package") +
theme_lex_viz(grid = "", arrows = "") +
theme(axis.text = element_blank())Sources (113)
3967 occurrences in the corpus; indexed by 19 books
Show the 113 sources
- 100 diagrams that changed the world: from the earliest cave paintings to the innovation...
- A field guide to digital color
- Applied Multivariate Statistics in R
- Atlas of knowledge: anyone can map
- Ault, Nam Liao & Musolino, Principles of Data Science, OpenStax, 2025
- Barnier, Introduction à R et au tidyverse
- Beautiful evidence
- Better data visualizations: a guide for scholars, researchers, and wonks
- Bremer & Barone, Chart, CRC Press, 2025
- Building Science Graphics: An Illustrated Guide to Communicating Science through Diagra...
- Cartographies of Time
- Cartography: thematic map design
- Ciccione et al., The Superiority of Graphics over Text in Long-Term Memory Retention, Psychonomic Bulletin & Review, 2025↗
- Computational statistics in data science
- Cook & Laa, Interactively Exploring High-Dimensional Data and Models in R, Chapman & Hall/CRC, 2026
- Data Feminism
- Data fluency: empowering your organization with effective data communication
- Data points: visualization that means something
- Data sketches
- Data story: explain data and inspire action through story
- Data Visualisation Guide, data.europa.eu
- Data visualisation: a handbook for data driven design
- Data visualization handbook
- Data visualization literacy: Definitions, conceptual frameworks, exercises, and assessm...
- Data visualization: a practical introduction
- Data-driven storytelling
- data-to-viz.com
- Dear data
- Dehaene, “The Perception of Graphics: A New Instance of Neuronal Recycling”, lecture course at the Collège de France, 2025 (in French)↗
- Design for information: an introduction to the histories, theories, and best practices ...
- Effective data storytelling: how to drive change with data, narrative, and visuals
- Effective data visualization: the right chart for the right data
- Elavsky, Chartability: POUR-CAF accessibility heuristics
- Envisioning information
- Exploratory Data Analysis: Descriptive Analysis, Visualization, and Dashboard Design (w...
- French Wikipedia — Visualisation de données
- Friendly & Wainer, A History of Data Visualization and Graphic Communication, Harvard University Press, 2021
- From data to viz
- Fundamentals of computer graphics
- Graphic presentation
- Graphics for learning: proven guidelines for planning, designing, and evaluating visual...
- Graphiques : vocabulaire, EBSI Montreal (after the GDT)↗
- Grosjean & Engels, Science des données biologiques I-III (University of Mons)
- Handling and mapping geographic information
- How charts lie: getting smarter about visual information
- How maps work: representation, visualization, and design
- How to lie with statistics
- Impossible to ignore: creating memorable content to influence decisions
- Info we trust: how to inspire the world with data
- Information graphics
- Information Graphics: A Comprehensive Illustrated Reference
- Information theory tools for visualization
- Insee, Guide de sémiologie graphique, édition 2017↗
- Interactive data visualization: foundations, techniques, and applications
- L’Atlas Molière
- La graphique et le traitement graphique de l'information
- Lagarenne, Minodier & Samson, « Comment présenter nos données pour mieux communiquer ? La datavisualisation : synthèse et simplicité », Courrier des statistiques n° 10 (Insee), 2023↗
- Lagnel, Manuel de datavisualisation, Dunod, 2021
- Larmarange et al., analyse-R: introduction to survey analysis with R
- Larmarange, guide-R: analysing survey data with R
- Les fondamentaux de la visualisation de données
- LibreTexts Statistics, textbook chapters on charts
- Living in data: a citizen's guide to a better information
- Magrit user manual, French version (UAR RIATE, CNRS)
- Making and Breaking the Grid, Third Edition
- Making numbers count: the art and science of communicating numbers
- Manuel de datavisualisation - 2e éd, vol. 2
- Milestones in the history of thematic cartography, statistical graphics, and data visua...
- More Practical Charts
- Nature, formatting guide↗
- Open Visualization Academy, courses and newsletter (Cairo et al.)
- Parallel sets: visual analysis of categorical data
- PBIL biostatistics notes (Chessel, Dufour, Thioulouse et al., Lyon 1)
- Practical charts: the essential guide to creating clear, compelling charts for reports ...
- Progressive Data Analysis: Roadmap and Research Agenda
- QCBS R Workshop Series, French version (Quebec Centre for Biodiversity Science)
- Questions in Dataviz: A Design-Driven Process for Data Visualisation
- Rakotomalala, statistics course notes (Université Lyon 2)
- RGAA, French accessibility framework: glossary, criteria and tests
- Seeing with fresh eyes: meaning, space, data, truth
- Semiologie graphique: les diagrammes, les réseaux, les cartes.
- Semiology of graphics: diagrams, networks, maps
- Show me the numbers: designing tables and graphs to enlighten
- Stop Misusing t-SNE and UMAP for Visual Analytics
- Storytelling with data: let's practice!
- The art of insight: how great visualization designers think
- The big book of dashboards: visualizing your data using real-world business scenarios
- The book of circles: visualizing spheres of knowledge
- The book of trees: visualizing branches of knowledge
- The elements of graphing data
- The elements of typographic style
- The eyes have it: A task by data type taxonomy for information visualizations
- The functional art: an introduction to information graphics and visualization
- The golden age of data visualization: how did we get here?
- The grammar of graphics
- The infographic history of the world
- The Minard System: The Complete Statistical Graphics of Charles-Joseph Minard
- The Oxford Handbook of Empirical Aesthetics
- The Truthful Art: Data, Charts, and Maps for Communication
- The visual display of quantitative information
- The Wall Street journal guide to information graphics: the dos and don'ts of presenting...
- Thematic Cartography and Geovisualization
- UMATO: Bridging Local and Global Structures for Reliable Visual Analytics With Dimensio...
- Visual complexity: mapping patterns of information
- Visual explanations: images and quantities, evidence and narrative
- Visual strategies for biological data
- Visualization Analysis and Design
- Visualization of Time-Oriented Data
- Visualize This
- Visualizing with text
- Wainer & Friendly, On the Origins of Data Visualization, 2022
- wiki.wordsoftype.com
- Wikipedia in English↗ fr
Cite this entry
Stable addresshttps://dataviz.adrientaudiere.com/en/term/data-table.html
ReferenceTaudière Adrien. 2026. data table. In Visualization Vocabulary, version 1.0.0. IdEst. https://dataviz.adrientaudiere.com/en/term/data-table.html
BibTeX
@incollection{taudiere2026-data-table,
  author    = {Taudière, Adrien},
  title     = {data table},
  booktitle = {Visualization Vocabulary},
  year      = {2026},
  version   = {1.0.0},
  publisher = {IdEst},
  url       = {https://dataviz.adrientaudiere.com/en/term/data-table.html},
  note      = {CC0 1.0}
}Page created on 2026-10-13. Text last changed on 2026-11-12. Images last changed on 2026-11-09. Numbers computed on 2026-10-22.