
 graphique
tableau de données
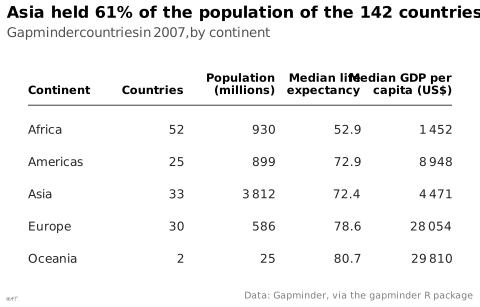
Présentation des valeurs exactes en lignes et colonnes.
data table
also: tablePresentation of exact values in rows and columns.
Souvent préférable au graphique sous une vingtaine de valeurs.
Exemples
Figure à voir chez Lu Guan, Weiying Shi, Qianqian Li, Jeffry Oktavianus, Mengmeng Wu ↗
Figure à voir chez Andrey Sitnik, Travis Turner (Evil Martians) ↗
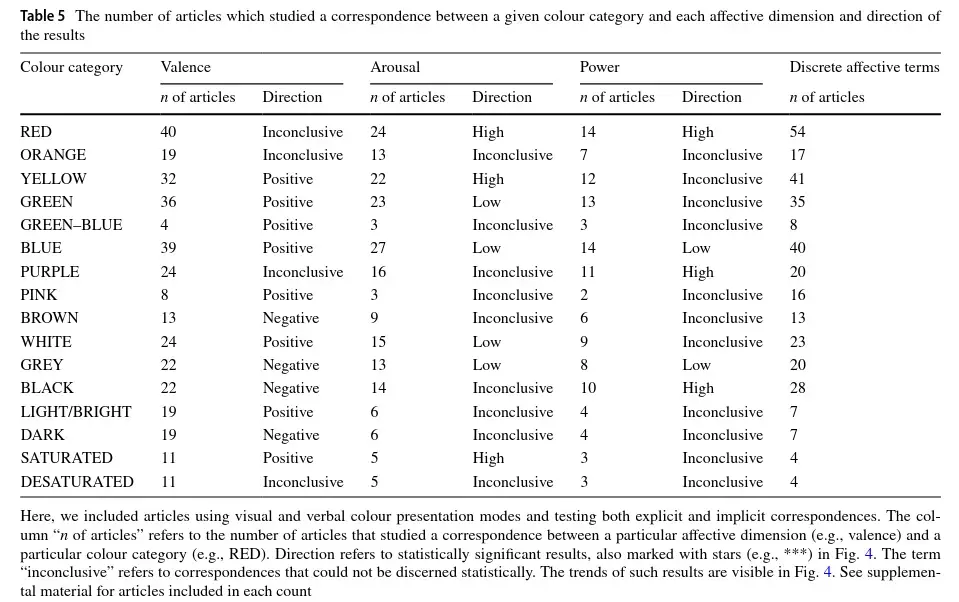
Figure à voir chez Tugba Kulahcioglu, Gerard de Melo ↗
Figure à voir chez Matthew Brehmer, Tamara Munzner ↗
Figure à voir chez Katy Börner, Andreas Bueckle, Michael Ginda ↗
Classification
- graphique
- matrices et tableaux › tableaux
Canaux
 luminance; secondaire : mise en évidence
 saturation; secondaire : mise en évidence (à la place de la luminance)
 région de l'espace; principal : ligne et colonne (les valeurs sont écrites, pas codées)
Attestation
- terme français : Lagnel, Manuel de datavisualisation, Dunod, 2021
- définition anglaise : Data Visualisation Guide, data.europa.eu
Paquets R
- R
gt::gt(); GitHub 2 162 étoiles; dernier commit 2026-10 - R
formattable::formattable(); GitHub 700 étoiles; dernier commit 2026-10
Code R de l'exemple ggplot2
library(ggplot2)
library(dplyr)
library(gapminder)
## A table drawn with ggplot2: one text per cell, numbers right-aligned on
## the right edge of their column, a rule under the header.
rows <- gapminder |>
filter(year == 2007) |>
group_by(continent) |>
summarise(countries = n(), pop = sum(as.numeric(pop)) / 1e6,
life = median(lifeExp), gdp = median(gdpPercap)) |>
mutate(row = rev(seq_along(continent)))
columns <- tibble(x = c(0, 2.9, 4.6, 6.2, 7.9), hjust = c(0, 1, 1, 1, 1),
header = c("Continent", "Countries", "Population\n(millions)",
"Median life\nexpectancy", "Median GDP per\ncapita (US$)"))
cells <- bind_rows(
tibble(col = 1, label = as.character(rows$continent), row = rows$row),
tibble(col = 2, label = as.character(rows$countries), row = rows$row),
tibble(col = 3, label = lex_number(round(rows$pop)), row = rows$row),
tibble(col = 4, label = sprintf("%.1f", rows$life), row = rows$row),
tibble(col = 5, label = lex_number(round(rows$gdp)), row = rows$row)
) |>
mutate(x = columns$x[col], hjust = columns$hjust[col])
p <- ggplot() +
geom_text(data = columns, aes(x = x, y = 6.1, label = header, hjust = hjust),
vjust = 0, fontface = "bold", colour = "black", size = 3, lineheight = 0.9) +
annotate("segment", x = 0, xend = 7.9, y = 5.75, yend = 5.75, colour = "#535353", linewidth = 0.4) +
geom_text(data = cells, aes(x = x, y = row, label = label, hjust = hjust),
colour = "#262626", size = 3.2) +
scale_y_continuous(limits = c(0.5, 7.2)) +
labs(title = "Asia held 61% of the population of the 142 countries",
subtitle = "Gapminder countries in 2007, by continent",
x = NULL, y = NULL,
caption = "Data: Gapminder, via the gapminder R package") +
theme_lex_viz(grid = "", arrows = "") +
theme(axis.text = element_blank())Sources (113)
3967 occurrences dans le corpus; indexé par 19 ouvrages
Afficher les 113 sources
- 100 diagrams that changed the world: from the earliest cave paintings to the innovation...
- A field guide to digital color
- Applied Multivariate Statistics in R
- Atlas of knowledge: anyone can map
- Ault, Nam Liao & Musolino, Principles of Data Science, OpenStax, 2025
- Barnier, Introduction à R et au tidyverse
- Beautiful evidence
- Better data visualizations: a guide for scholars, researchers, and wonks
- Bremer & Barone, Chart, CRC Press, 2025
- Building Science Graphics: An Illustrated Guide to Communicating Science through Diagra...
- Cartographies of Time
- Cartography: thematic map design
- Ciccione et al., The Superiority of Graphics over Text in Long-Term Memory Retention, Psychonomic Bulletin & Review, 2025↗
- Computational statistics in data science
- Cook & Laa, Interactively Exploring High-Dimensional Data and Models in R, Chapman & Hall/CRC, 2026
- Data Feminism
- Data fluency: empowering your organization with effective data communication
- Data points: visualization that means something
- Data sketches
- Data story: explain data and inspire action through story
- Data Visualisation Guide, data.europa.eu
- Data visualisation: a handbook for data driven design
- Data visualization handbook
- Data visualization literacy: Definitions, conceptual frameworks, exercises, and assessm...
- Data visualization: a practical introduction
- Data-driven storytelling
- data-to-viz.com
- Dear data
- Dehaene, « La perception des graphiques : un nouvel exemple de recyclage neuronal », cours au Collège de France, 2025↗
- Design for information: an introduction to the histories, theories, and best practices ...
- Effective data storytelling: how to drive change with data, narrative, and visuals
- Effective data visualization: the right chart for the right data
- Elavsky, Chartability : heuristiques d'accessibilité POUR-CAF
- Envisioning information
- Exploratory Data Analysis: Descriptive Analysis, Visualization, and Dashboard Design (w...
- Fiches de biostatistique du PBIL (Chessel, Dufour, Thioulouse et al., Lyon 1)
- Friendly & Wainer, A History of Data Visualization and Graphic Communication, Harvard University Press, 2021
- From data to viz
- Fundamentals of computer graphics
- Graphic presentation
- Graphics for learning: proven guidelines for planning, designing, and evaluating visual...
- Graphiques : vocabulaire, EBSI Montréal (d'après le GDT)↗
- Grosjean & Engels, Science des données biologiques I-III (Université de Mons)
- Handling and mapping geographic information
- How charts lie: getting smarter about visual information
- How maps work: representation, visualization, and design
- How to lie with statistics
- Impossible to ignore: creating memorable content to influence decisions
- Info we trust: how to inspire the world with data
- Information graphics
- Information Graphics: A Comprehensive Illustrated Reference
- Information theory tools for visualization
- Insee, Guide de sémiologie graphique, édition 2017↗
- Interactive data visualization: foundations, techniques, and applications
- L’Atlas Molière
- La graphique et le traitement graphique de l'information
- Lagarenne, Minodier & Samson, « Comment présenter nos données pour mieux communiquer ? La datavisualisation : synthèse et simplicité », Courrier des statistiques n° 10 (Insee), 2023↗
- Lagnel, Manuel de datavisualisation, Dunod, 2021
- Larmarange et al., analyse-R : introduction à l'analyse d'enquêtes avec R
- Larmarange, guide-R : guide pour l'analyse de données d'enquêtes avec R
- Les fondamentaux de la visualisation de données
- LibreTexts Statistics, chapitres de manuels sur les figures
- Living in data: a citizen's guide to a better information
- Magrit, manuel d'utilisation (UAR RIATE, CNRS)
- Making and Breaking the Grid, Third Edition
- Making numbers count: the art and science of communicating numbers
- Manuel de datavisualisation - 2e éd, vol. 2
- Milestones in the history of thematic cartography, statistical graphics, and data visua...
- More Practical Charts
- Nature, consignes de mise en forme↗
- Open Visualization Academy, cours et lettre d'information (Cairo et al.)
- Parallel sets: visual analysis of categorical data
- Practical charts: the essential guide to creating clear, compelling charts for reports ...
- Progressive Data Analysis: Roadmap and Research Agenda
- Questions in Dataviz: A Design-Driven Process for Data Visualisation
- Rakotomalala, fascicules de cours de statistique (Université Lyon 2)
- RGAA, référentiel général d'amélioration de l'accessibilité : glossaire, critères et tests
- Seeing with fresh eyes: meaning, space, data, truth
- Semiologie graphique: les diagrammes, les réseaux, les cartes.
- Semiology of graphics: diagrams, networks, maps
- Série d'ateliers R du CSBQ, version française (Centre de la science de la biodiversité du Québec)
- Show me the numbers: designing tables and graphs to enlighten
- Stop Misusing t-SNE and UMAP for Visual Analytics
- Storytelling with data: let's practice!
- The art of insight: how great visualization designers think
- The big book of dashboards: visualizing your data using real-world business scenarios
- The book of circles: visualizing spheres of knowledge
- The book of trees: visualizing branches of knowledge
- The elements of graphing data
- The elements of typographic style
- The eyes have it: A task by data type taxonomy for information visualizations
- The functional art: an introduction to information graphics and visualization
- The golden age of data visualization: how did we get here?
- The grammar of graphics
- The infographic history of the world
- The Minard System: The Complete Statistical Graphics of Charles-Joseph Minard
- The Oxford Handbook of Empirical Aesthetics
- The Truthful Art: Data, Charts, and Maps for Communication
- The visual display of quantitative information
- The Wall Street journal guide to information graphics: the dos and don'ts of presenting...
- Thematic Cartography and Geovisualization
- UMATO: Bridging Local and Global Structures for Reliable Visual Analytics With Dimensio...
- Visual complexity: mapping patterns of information
- Visual explanations: images and quantities, evidence and narrative
- Visual strategies for biological data
- Visualization Analysis and Design
- Visualization of Time-Oriented Data
- Visualize This
- Visualizing with text
- Wainer & Friendly, On the Origins of Data Visualization, 2022
- wiki.wordsoftype.com
- Wikipédia — Visualisation de données
- Wikipedia in English↗ fr
Citer cette fiche
Adresse stablehttps://dataviz.adrientaudiere.com/terme/data-table.html
RéférenceTaudière Adrien. 2026. tableau de données. Dans Visualization Vocabulary, version 1.0.0. IdEst. https://dataviz.adrientaudiere.com/terme/data-table.html
BibTeX
@incollection{taudiere2026-data-table,
  author    = {Taudière, Adrien},
  title     = {tableau de données},
  booktitle = {Visualization Vocabulary},
  year      = {2026},
  version   = {1.0.0},
  publisher = {IdEst},
  url       = {https://dataviz.adrientaudiere.com/terme/data-table.html},
  note      = {CC0 1.0}
}Fiche créée le 13/10/2026. Texte modifié le 12/11/2026. Images modifiées le 09/11/2026. Chiffres calculés le 22/10/2026.