
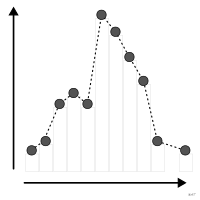
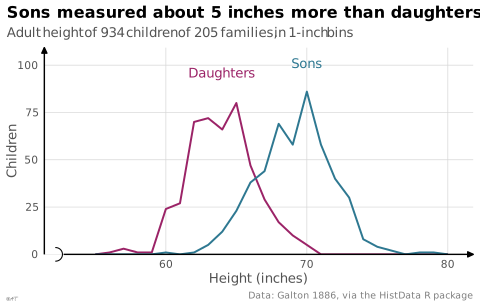
 chart
frequency polygon
also: distribution line chartDistribution drawn as a line joining the tops of the bins.
polygone des fréquences
Distribution tracée en ligne brisée reliant les sommets des classes.
Préférable à l'histogramme pour superposer plusieurs distributions.
Classification
- chart
- lines and areas › statistical curves
- distribution; Financial Times Visual Vocabulary
Channels
 position on common scale; main: count per bin
Variants
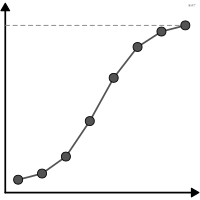 ogivecumulative
Attestation
- French term: Grand dictionnaire terminologique, OQLF (via EBSI, Montreal)
- English definition: Desbarats, More Practical Charts, 2024
Scientific literature
OpenAlex: 329 papers since 1925, 18% in the last five years; mostly in Mathematics, Social Sciences, Agricultural and Biological Sciences
Seminal references
R packages
- R
ggplot2::geom_freqpoly(); GitHub 7 025 stars; last commit 2026-10; paper (33 455 citations)
R code of the ggplot2 example
library(ggplot2)
library(dplyr)
library(HistData)
children <- GaltonFamilies |>
mutate(child = factor(gender, levels = c("female", "male"), labels = c("Daughters", "Sons")))
## Each name goes above the peak of its polygon, in the same 1-inch bins.
peaks <- children |>
count(child, height = round(childHeight)) |>
group_by(child) |>
slice_max(n, n = 1, with_ties = FALSE)
p <- ggplot(children, aes(x = childHeight, colour = child)) +
geom_freqpoly(binwidth = 1, center = 0, linewidth = 0.7) +
geom_text(data = peaks, aes(x = height, y = n, label = child), vjust = -0.7, size = 3.5) +
scale_x_continuous(labels = lex_number, breaks = lex_break_breaks, expand = lex_break_expand) +
scale_y_continuous(labels = lex_number, expand = expansion(mult = c(0, 0.15))) +
labs(title = "Sons measured about 5 inches more than daughters",
subtitle = "Adult height of 934 children of 205 families, in 1-inch bins",
x = "Height (inches)", y = "Children",
caption = "Data: Galton 1886, via the HistData R package") +
theme_lex_viz(break_not_zero = "x") +
theme(legend.position = "none")Sources (15)
54 occurrences in the corpus; indexed by 5 books
Show the 15 sources
- Cartography: thematic map design
- Data visualization: a practical introduction
- Desbarats, More Practical Charts, 2024
- Friendly & Wainer, A History of Data Visualization and Graphic Communication, Harvard University Press, 2021
- Grand dictionnaire terminologique, OQLF (via EBSI, Montreal)
- Graphiques : vocabulaire, EBSI Montreal (after the GDT)↗
- Information Graphics: A Comprehensive Illustrated Reference
- LibreTexts Statistics, textbook chapters on charts
- Milestones in the history of thematic cartography, statistical graphics, and data visua...
- More Practical Charts
- Show me the numbers: designing tables and graphs to enlighten
- StatsLearn, “Graphs and displays” glossary↗
- The grammar of graphics
- Wickham, Çetinkaya-Rundel & Grolemund, R for Data Science, 2nd ed., 2023
- Wickham, Navarro & Pedersen, ggplot2: Elegant Graphics for Data Analysis, 3rd ed. online↗
Cite this entry
Stable addresshttps://dataviz.adrientaudiere.com/en/term/frequency-polygon.html
ReferenceTaudière Adrien. 2026. frequency polygon. In Visualization Vocabulary, version 1.0.0. IdEst. https://dataviz.adrientaudiere.com/en/term/frequency-polygon.html
BibTeX
@incollection{taudiere2026-frequency-polygon,
  author    = {Taudière, Adrien},
  title     = {frequency polygon},
  booktitle = {Visualization Vocabulary},
  year      = {2026},
  version   = {1.0.0},
  publisher = {IdEst},
  url       = {https://dataviz.adrientaudiere.com/en/term/frequency-polygon.html},
  note      = {CC0 1.0}
}Page created on 2026-10-13. Text last changed on 2026-10-22. Images last changed on 2026-11-12. Numbers computed on 2026-10-22.