
 chart
ogive
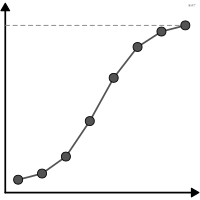
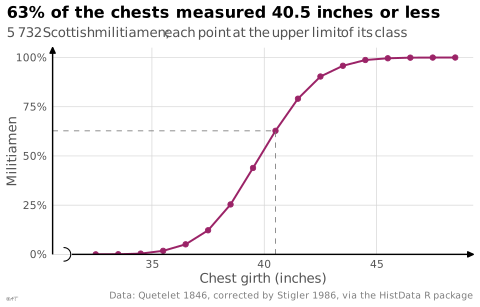
also: cumulative frequency polygon, ogive curve, cumulative frequency graphPolygon joining the cumulative frequencies at the upper class limits.
ogive
aussi : courbe des fréquences cumulées, polygone des fréquences cumuléesPolygone qui relie les fréquences cumulées aux bornes supérieures des classes.
Le nom vient de l'arc en ogive, que la courbe rappelle ; il est dû à Galton selon les Milestones de Friendly. Wikipédia EN l'étend à toute fonction de répartition empirique, qui a sa propre entrée.
Classification
- chart
- lines and areas › statistical curves
- distribution
- the name evokes: building
Variants
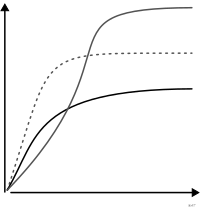 rarefaction curvespecial case
Attestation
Scientific literature
OpenAlex: 2 668 papers since 1884, 16% in the last five years; mostly in Engineering, Agricultural and Biological Sciences, Decision Sciences; Wikidata
Seminal references
R code of the ggplot2 example
library(ggplot2)
library(dplyr)
library(HistData)
## Stigler's corrected table. Each cumulative share goes at the upper limit
## of its class, half an inch above the recorded size; the polygon starts at 0
## at the lower limit of the first class.
ogive <- ChestStigler |>
arrange(chest) |>
mutate(upper = chest + 0.5, share = cumsum(count) / sum(count))
ogive <- bind_rows(tibble(upper = min(ogive$chest) - 0.5, share = 0), ogive)
at_40 <- filter(ogive, upper == 40.5)
p <- ggplot(ogive, aes(x = upper, y = share)) +
geom_line(linewidth = 0.7, colour = "#9b2367") +
geom_point(size = 1.6, colour = "#9b2367") +
annotate("segment", x = -Inf, xend = at_40$upper, y = at_40$share, yend = at_40$share,
colour = "#7d7d7d", linetype = "dashed", linewidth = 0.3) +
annotate("segment", x = at_40$upper, xend = at_40$upper, y = -Inf, yend = at_40$share,
colour = "#7d7d7d", linetype = "dashed", linewidth = 0.3) +
scale_x_continuous(labels = lex_number, breaks = lex_break_breaks, expand = lex_break_expand) +
scale_y_continuous(labels = scales::label_percent(), expand = expansion(mult = c(0, 0.05))) +
labs(title = paste0(scales::percent(at_40$share, accuracy = 1),
" of the chests measured 40.5 inches or less"),
subtitle = paste0(format(sum(ChestStigler$count), big.mark = "\u2009"),
" Scottish militiamen; each point at the upper limit of its class"),
x = "Chest girth (inches)", y = "Militiamen",
caption = "Data: Quetelet 1846, corrected by Stigler 1986, via the HistData R package") +
theme_lex_viz(break_not_zero = "x")Sources (10)
67 occurrences in the corpus; indexed by 3 books
- Cartography: thematic map design
- French Wikipedia↗
- Graphic presentation
- Information Graphics: A Comprehensive Illustrated Reference
- LibreTexts Statistics, textbook chapters on charts
- Milestones in the history of thematic cartography, statistical graphics, and data visua...
- Régnier, « Histogramme », Enseigner la statistique du CM à la Seconde. Pourquoi ? Comment ?, IREM de Lyon, 1998↗
- StatsLearn, “Graphs and displays” glossary↗
- The grammar of graphics
- Wikipedia in English↗
Cite this entry
Stable addresshttps://dataviz.adrientaudiere.com/en/term/ogive.html
ReferenceTaudière Adrien. 2026. ogive. In Visualization Vocabulary, version 1.0.0. IdEst. https://dataviz.adrientaudiere.com/en/term/ogive.html
BibTeX
@incollection{taudiere2026-ogive,
  author    = {Taudière, Adrien},
  title     = {ogive},
  booktitle = {Visualization Vocabulary},
  year      = {2026},
  version   = {1.0.0},
  publisher = {IdEst},
  url       = {https://dataviz.adrientaudiere.com/en/term/ogive.html},
  note      = {CC0 1.0}
}Page created on 2026-10-13. Text last changed on 2026-11-02. Images last changed on 2026-11-12. Numbers computed on 2026-10-22.