
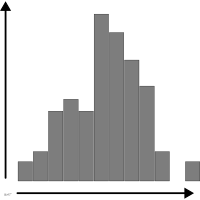

 chart
histogram
also: frequency chartDistribution of a continuous variable split into bins.
histogramme
Distribution d'une variable continue découpée en classes.
Faux-ami courant : en français « histogramme » désigne souvent à tort un diagramme en barres.
Classification
- chart
- bars › simple bars
- distribution; Financial Times Visual Vocabulary
Channels
 position on common scale; main: count per bin; bin on the x-axis; Munzner 2014
 length; main: count; Munzner 2014
Variants
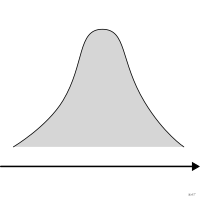 density plotsmoothed
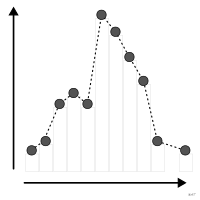 frequency polygonpolyline
Attestation and synonyms
- French term: Lagnel, Manuel de datavisualisation, Dunod, 2021
- English definition: Brinton, Graphic Presentation, 1939↗
- frequency chart; Brinton, Graphic Presentation, 1939↗
Scientific literature
OpenAlex: 148 159 papers since 1899, 25% in the last five years; mostly in Computer Science, Medicine, Physics and Astronomy; Wikidata
Seminal references
R packages
- R
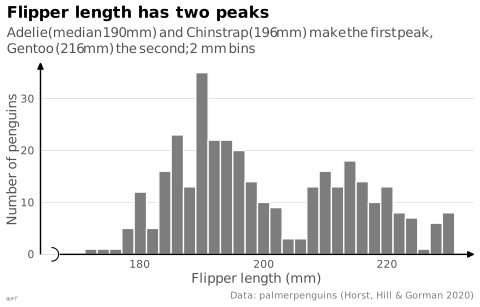
ggplot2::geom_histogram(); GitHub 7 025 stars; last commit 2026-10; paper (33 455 citations)
R code of the ggplot2 example
library(ggplot2)
library(palmerpenguins)
p <- ggplot(penguins, aes(x = flipper_length_mm)) +
geom_histogram(binwidth = 2, fill = "#7d7d7d", colour = "white", na.rm = TRUE) +
scale_x_continuous(labels = lex_number, breaks = lex_break_breaks, expand = lex_break_expand) +
scale_y_continuous(labels = lex_number, expand = expansion(mult = c(0, 0.05))) +
labs(title = "Flipper length has two peaks",
subtitle = "Adelie (median 190 mm) and Chinstrap (196 mm) make the first peak, Gentoo (216 mm) the second; 2 mm bins",
x = "Flipper length (mm)", y = "Number of penguins",
caption = "Data: palmerpenguins (Horst, Hill & Gorman 2020)") +
theme_lex_viz(grid = "y", break_not_zero = "x")Sources (97)
888 occurrences in the corpus; indexed by 26 books
Show the 97 sources
- 100 diagrams that changed the world: from the earliest cave paintings to the innovation...
- A field guide to digital color
- app.flourish.studio
- Applied Multivariate Statistics in R
- Atlas of knowledge: anyone can map
- Ault, Nam Liao & Musolino, Principles of Data Science, OpenStax, 2025
- Barnier, Introduction à R et au tidyverse
- Better data visualizations: a guide for scholars, researchers, and wonks
- blog.datawrapper.de↗
- Bremer & Barone, Chart, CRC Press, 2025
- Brinton, Graphic Presentation, 1939↗
- Building Science Graphics: An Illustrated Guide to Communicating Science through Diagra...
- Cartography: thematic map design
- Ciccione, Sablé-Meyer & Dehaene, Analyzing the Misperception of Exponential Growth in Graphs, Cognition, 2022↗
- Computational statistics in data science
- Cook & Laa, Interactively Exploring High-Dimensional Data and Models in R, Chapman & Hall/CRC, 2026
- Data fluency: empowering your organization with effective data communication
- Data points: visualization that means something
- Data sketches
- Data Visualisation Guide, data.europa.eu
- Data visualisation: a handbook for data driven design
- Data visualization handbook
- Data visualization literacy: Definitions, conceptual frameworks, exercises, and assessm...
- Data visualization: a practical introduction
- Data Viz Project
- Data-driven storytelling
- data-to-viz.com
- dataphys.org
- datavizcatalogue.com
- datavizindex.fr
- datavizproject.com
- datawrapper.de↗
- Dehaene, “The Perception of Graphics: A New Instance of Neuronal Recycling”, lecture course at the Collège de France, 2025 (in French)↗
- Design for information: an introduction to the histories, theories, and best practices ...
- Effective data storytelling: how to drive change with data, narrative, and visuals
- Effective data visualization: the right chart for the right data
- Envisioning information
- Exploratory Data Analysis: Descriptive Analysis, Visualization, and Dashboard Design (w...
- French Wikipedia↗
- French Wikipedia — Visualisation de données
- Friendly & Wainer, A History of Data Visualization and Graphic Communication, Harvard University Press, 2021
- From data to viz
- Fundamentals of computer graphics
- Graphic presentation
- Graphiques : vocabulaire, EBSI Montreal (after the GDT)↗
- Grosjean & Engels, Science des données biologiques I-III (University of Mons)
- Handling and mapping geographic information
- How charts lie: getting smarter about visual information
- How maps work: representation, visualization, and design
- Info we trust: how to inspire the world with data
- Information graphics
- Information Graphics: A Comprehensive Illustrated Reference
- Information theory tools for visualization
- Insee, Guide de sémiologie graphique, édition 2017↗
- Interactive data visualization: foundations, techniques, and applications
- La graphique et le traitement graphique de l'information
- Lagnel, Manuel de datavisualisation, Dunod, 2021
- Larmarange et al., analyse-R: introduction to survey analysis with R
- Larmarange, guide-R: analysing survey data with R
- Les fondamentaux de la visualisation de données
- LibreTexts Statistics, textbook chapters on charts
- Magrit user manual, French version (UAR RIATE, CNRS)
- Manuel de datavisualisation - 2e éd, vol. 2
- Milestones in the history of thematic cartography, statistical graphics, and data visua...
- More Practical Charts
- Open Visualization Academy, courses and newsletter (Cairo et al.)
- Parallel sets: visual analysis of categorical data
- PBIL biostatistics notes (Chessel, Dufour, Thioulouse et al., Lyon 1)
- Progressive Data Analysis: Roadmap and Research Agenda
- python-graph-gallery.com
- QCBS R Workshop Series, French version (Quebec Centre for Biodiversity Science)
- Rakotomalala, statistics course notes (Université Lyon 2)
- royal-statistical-society.github.io
- Semiologie graphique: les diagrammes, les réseaux, les cartes.
- Semiology of graphics: diagrams, networks, maps
- Show me the numbers: designing tables and graphs to enlighten
- StatsLearn, “Graphs and displays” glossary↗
- The big book of dashboards: visualizing your data using real-world business scenarios
- The elements of graphing data
- The golden age of data visualization: how did we get here?
- The grammar of graphics
- The Oxford Handbook of Empirical Aesthetics
- The Truthful Art: Data, Charts, and Maps for Communication
- The visual display of quantitative information
- Thematic Cartography and Geovisualization
- utilitR, collaborative R documentation (Insee)
- Visual strategies for biological data
- Visualization Analysis and Design
- Visualization of Time-Oriented Data
- Visualize This
- Visualizing with text
- Wickham, Çetinkaya-Rundel & Grolemund, R for Data Science, 2nd ed., 2023
- Wickham, Navarro & Pedersen, ggplot2: Elegant Graphics for Data Analysis, 3rd ed. online↗
- Wikipedia — Data and information visualization
- Wikipedia in English↗
- Wilke, Fundamentals of Data Visualization, O'Reilly, 2019
- xeno.graphics↗
Cite this entry
Stable addresshttps://dataviz.adrientaudiere.com/en/term/histogram.html
ReferenceTaudière Adrien. 2026. histogram. In Visualization Vocabulary, version 1.0.0. IdEst. https://dataviz.adrientaudiere.com/en/term/histogram.html
BibTeX
@incollection{taudiere2026-histogram,
  author    = {Taudière, Adrien},
  title     = {histogram},
  booktitle = {Visualization Vocabulary},
  year      = {2026},
  version   = {1.0.0},
  publisher = {IdEst},
  url       = {https://dataviz.adrientaudiere.com/en/term/histogram.html},
  note      = {CC0 1.0}
}Page created on 2026-10-13. Text last changed on 2026-10-22. Images last changed on 2026-11-12. Numbers computed on 2026-10-22.