
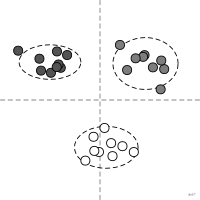
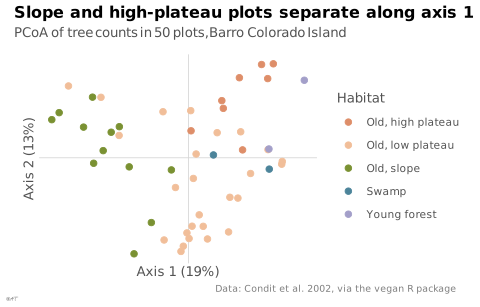
 chart
ordination
Projection of objects described by many variables into a low-dimensional space.
ordination
Projection d'objets décrits par de nombreuses variables dans un espace de faible dimension.
Terme d'écologie numérique : ACP, AFC, NMDS et PCoA en sont des cas.
Classification
- chart
- points and bubbles › scatterplots
- correlation
Channels
 position on common scale; main: coordinates on the axes
 color hue; secondary: group
 shape; secondary: group
Variants
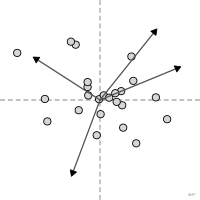 biplotvariable arrows
Attestation
- French term: French Wikipedia
Scientific literature
OpenAlex: 578 papers since 1977, 18% in the last five years; mostly in Environmental Science, Agricultural and Biological Sciences, Earth and Planetary Sciences; Wikidata
Seminal references
R packages
- R
vegan::ordiplot(); GitHub 551 stars; last commit 2026-10 - R
barrel::stat_barrel(); paper (0 citations)
R code of the ggplot2 example
library(ggplot2)
library(vegan)
## Principal coordinates of the Bray-Curtis dissimilarities between plots.
data(BCI, BCI.env)
pcoa <- cmdscale(vegdist(BCI, method = "bray"), k = 2, eig = TRUE)
share <- scales::percent(pcoa$eig[1:2] / sum(pcoa$eig[pcoa$eig > 0]), accuracy = 1)
habitats <- c(OldHigh = "Old, high plateau", OldLow = "Old, low plateau", OldSlope = "Old, slope",
Swamp = "Swamp", Young = "Young forest")
plots <- data.frame(pcoa$points, habitat = habitats[as.character(BCI.env$Habitat)])
p <- ggplot(plots, aes(x = X1, y = X2, colour = habitat)) +
geom_hline(yintercept = 0, colour = "#d6d6d6", linewidth = 0.3) +
geom_vline(xintercept = 0, colour = "#d6d6d6", linewidth = 0.3) +
geom_point(size = 2) +
coord_fixed() +
labs(title = "Slope and high-plateau plots separate along axis 1",
subtitle = "PCoA of tree counts in 50 plots, Barro Colorado Island",
x = paste0("Axis 1 (", share[1], ")"), y = paste0("Axis 2 (", share[2], ")"),
colour = "Habitat",
caption = "Data: Condit et al. 2002, via the vegan R package") +
theme_lex_viz(grid = "", arrows = "") +
theme(axis.text = element_blank(), legend.position = "right", legend.direction = "vertical")Sources (9)
366 occurrences in the corpus
- Applied Multivariate Statistics in R
- Cartographies of Time
- French Wikipedia
- Grosjean & Engels, Science des données biologiques I-III (University of Mons)
- PBIL biostatistics notes (Chessel, Dufour, Thioulouse et al., Lyon 1)
- QCBS R Workshop Series, French version (Quebec Centre for Biodiversity Science)
- Visualization Analysis and Design
- Wikipedia — Data and information visualization
- Wikipedia in English↗ fr
Cite this entry
Stable addresshttps://dataviz.adrientaudiere.com/en/term/ordination.html
ReferenceTaudière Adrien. 2026. ordination. In Visualization Vocabulary, version 1.0.0. IdEst. https://dataviz.adrientaudiere.com/en/term/ordination.html
BibTeX
@incollection{taudiere2026-ordination,
  author    = {Taudière, Adrien},
  title     = {ordination},
  booktitle = {Visualization Vocabulary},
  year      = {2026},
  version   = {1.0.0},
  publisher = {IdEst},
  url       = {https://dataviz.adrientaudiere.com/en/term/ordination.html},
  note      = {CC0 1.0}
}Page created on 2026-10-13. Text last changed on 2026-11-02. Images last changed on 2026-11-12. Numbers computed on 2026-10-22.