

 chart
phylogenetic tree
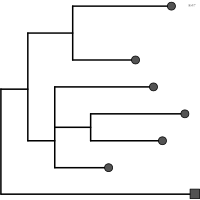
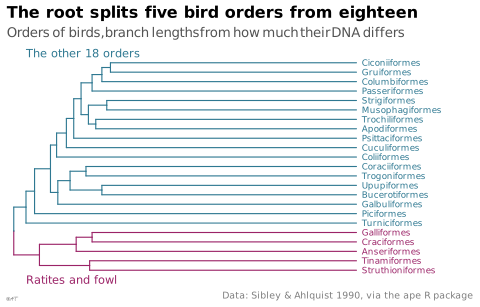
Tree showing the kinship relationships between taxa.
arbre phylogénétique
aussi : phylogénieArbre figurant les relations de parenté entre taxons.
La longueur des branches ne code une quantité que si la figure le dit.
Classification
- chart
- networks and trees › binary trees
- the name evokes: nature
Channels
 position on common scale; main: distance from the root
 length; main: branch length (evolutionary distance)
 color hue; secondary: clade
Attestation
- French term: French Wikipedia↗
Scientific literature
Seminal references
- first known use (1837) Darwin (1837). Notebook B: Transmutation of species; Andrews 2017
- diffusion (1859) Darwin (1859). On the Origin of Species; Wikipedia in English
- diffusion (1866) Haeckel (1866). Generelle Morphologie der Organismen; Andrews 2017
R packages
- R
ggtree::ggtree(); GitHub 935 stars; last commit 2026-10; paper (4 860 citations) Bioconductor.
R code of the ggplot2 example
library(ggplot2)
library(ape)
library(ggtree)
data(bird.orders)
## The root splits the tree in two: ratites and fowl, then all other orders.
fowl <- c("Struthioniformes", "Tinamiformes", "Craciformes", "Galliformes", "Anseriformes")
tree <- groupOTU(bird.orders, list(fowl = fowl))
p <- ggtree(tree, aes(colour = group), linewidth = 0.4) +
geom_tiplab(size = 2.3, offset = 0.3, family = "Quicksand") +
annotate("text", x = 1, y = 0, label = "Ratites and fowl", colour = "#9b2367",
hjust = 0, size = 3) +
annotate("text", x = 1, y = 24, label = "The other 18 orders", colour = "#2e7891",
hjust = 0, size = 3) +
scale_colour_manual(values = c(`0` = "#2e7891", fowl = "#9b2367")) +
scale_x_continuous(expand = expansion(mult = c(0.02, 0.32))) +
labs(title = "The root splits five bird orders from eighteen",
subtitle = "Orders of birds, branch lengths from how much their DNA differs",
caption = "Data: Sibley & Ahlquist 1990, via the ape R package") +
theme_lex_viz(grid = "", arrows = "") +
theme(legend.position = "none", axis.text = element_blank(), axis.title = element_blank(),
axis.line = element_blank(), axis.ticks = element_blank())Sources (9)
18 occurrences in the corpus; indexed by 1 book
- Applied Multivariate Statistics in R
- Data visualization handbook
- dataphys.org
- Design for information: an introduction to the histories, theories, and best practices ...
- French Wikipedia↗
- Grosjean & Engels, Science des données biologiques I-III (University of Mons)
- PBIL biostatistics notes (Chessel, Dufour, Thioulouse et al., Lyon 1)
- The book of trees: visualizing branches of knowledge
- Wikipedia in English↗
Cite this entry
Stable addresshttps://dataviz.adrientaudiere.com/en/term/phylogenetic-tree.html
ReferenceTaudière Adrien. 2026. phylogenetic tree. In Visualization Vocabulary, version 1.0.0. IdEst. https://dataviz.adrientaudiere.com/en/term/phylogenetic-tree.html
BibTeX
@incollection{taudiere2026-phylogenetic-tree,
  author    = {Taudière, Adrien},
  title     = {phylogenetic tree},
  booktitle = {Visualization Vocabulary},
  year      = {2026},
  version   = {1.0.0},
  publisher = {IdEst},
  url       = {https://dataviz.adrientaudiere.com/en/term/phylogenetic-tree.html},
  note      = {CC0 1.0}
}Page created on 2026-10-13. Text last changed on 2026-11-02. Images last changed on 2026-11-12. Numbers computed on 2026-10-22.