

 graphique
arbre phylogénétique
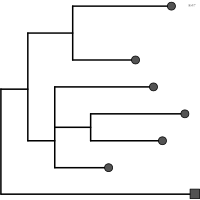
aussi : phylogénieArbre figurant les relations de parenté entre taxons.
phylogenetic tree
Tree showing the kinship relationships between taxa.
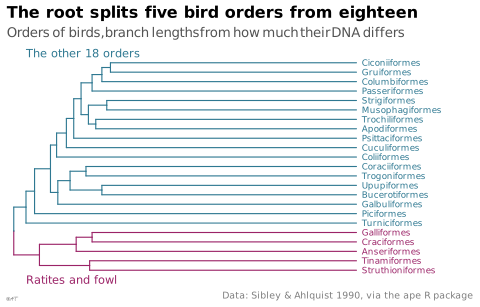
La longueur des branches ne code une quantité que si la figure le dit.
Classification
- graphique
- réseaux et arbres › arbres binaires
- le nom évoque : nature
Canaux
 position sur une échelle commune; principal : distance à la racine
 longueur; principal : longueur de branche (distance évolutive)
 teinte; secondaire : clade
Attestation
- terme français : Wikipédia en français↗
Littérature scientifique
Références séminales
- premier usage connu (1837) Darwin (1837). Notebook B: Transmutation of species; Andrews 2017
- diffusion (1859) Darwin (1859). On the Origin of Species; Wikipedia in English
- diffusion (1866) Haeckel (1866). Generelle Morphologie der Organismen; Andrews 2017
Paquets R
- R
ggtree::ggtree(); GitHub 935 étoiles; dernier commit 2026-10; article (4 860 citations) Bioconductor.
Code R de l'exemple ggplot2
library(ggplot2)
library(ape)
library(ggtree)
data(bird.orders)
## The root splits the tree in two: ratites and fowl, then all other orders.
fowl <- c("Struthioniformes", "Tinamiformes", "Craciformes", "Galliformes", "Anseriformes")
tree <- groupOTU(bird.orders, list(fowl = fowl))
p <- ggtree(tree, aes(colour = group), linewidth = 0.4) +
geom_tiplab(size = 2.3, offset = 0.3, family = "Quicksand") +
annotate("text", x = 1, y = 0, label = "Ratites and fowl", colour = "#9b2367",
hjust = 0, size = 3) +
annotate("text", x = 1, y = 24, label = "The other 18 orders", colour = "#2e7891",
hjust = 0, size = 3) +
scale_colour_manual(values = c(`0` = "#2e7891", fowl = "#9b2367")) +
scale_x_continuous(expand = expansion(mult = c(0.02, 0.32))) +
labs(title = "The root splits five bird orders from eighteen",
subtitle = "Orders of birds, branch lengths from how much their DNA differs",
caption = "Data: Sibley & Ahlquist 1990, via the ape R package") +
theme_lex_viz(grid = "", arrows = "") +
theme(legend.position = "none", axis.text = element_blank(), axis.title = element_blank(),
axis.line = element_blank(), axis.ticks = element_blank())Sources (9)
18 occurrences dans le corpus; indexé par 1 ouvrage
- Applied Multivariate Statistics in R
- Data visualization handbook
- dataphys.org
- Design for information: an introduction to the histories, theories, and best practices ...
- Fiches de biostatistique du PBIL (Chessel, Dufour, Thioulouse et al., Lyon 1)
- Grosjean & Engels, Science des données biologiques I-III (Université de Mons)
- The book of trees: visualizing branches of knowledge
- Wikipédia en français↗
- Wikipedia in English↗
Citer cette fiche
Adresse stablehttps://dataviz.adrientaudiere.com/terme/phylogenetic-tree.html
RéférenceTaudière Adrien. 2026. arbre phylogénétique. Dans Visualization Vocabulary, version 1.0.0. IdEst. https://dataviz.adrientaudiere.com/terme/phylogenetic-tree.html
BibTeX
@incollection{taudiere2026-phylogenetic-tree,
  author    = {Taudière, Adrien},
  title     = {arbre phylogénétique},
  booktitle = {Visualization Vocabulary},
  year      = {2026},
  version   = {1.0.0},
  publisher = {IdEst},
  url       = {https://dataviz.adrientaudiere.com/terme/phylogenetic-tree.html},
  note      = {CC0 1.0}
}Fiche créée le 13/10/2026. Texte modifié le 02/11/2026. Images modifiées le 12/11/2026. Chiffres calculés le 22/10/2026.