
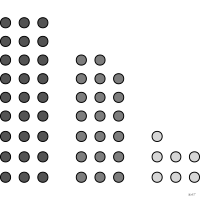
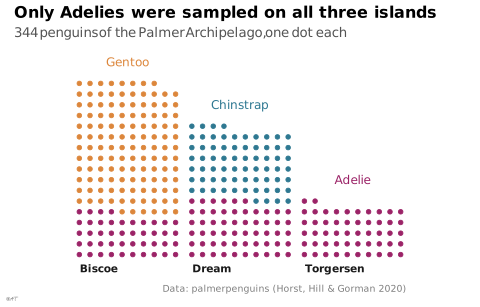
 chart
unit chart
also: dot matrix chartOne elementary shape per counted unit.
graphique en unités
aussi : unitéUne forme élémentaire par unité comptée.
Classification
- chart
- sectors, tilings and units › units
- magnitude
Channels
 color luminance; secondary: group
 color saturation; secondary: group (instead of luminance)
 spatial region; main: group
 color hue; secondary: category
 shape; secondary: category
Variants
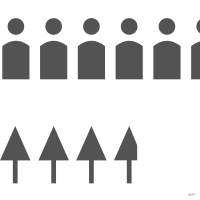 pictogramicons
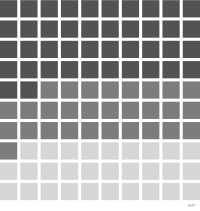 waffle chartsquare grid
Attestation
- French term: Lagnel, Manuel de datavisualisation, Dunod, 2021
- English definition: Data Visualisation Guide, data.europa.eu
Scientific literature
OpenAlex: 53 papers since 1991, 30% in the last five years; mostly in Medicine, Computer Science, Engineering
Seminal references
R packages
- R
waffle::geom_pictogram(); GitHub 798 stars; last commit 2023-09 Retiré du CRAN : à installer depuis GitHub.
R code of the ggplot2 example
library(ggplot2)
library(dplyr)
library(palmerpenguins)
## One dot per penguin, stacked by island in rows of ten.
units <- penguins |>
arrange(island, species) |>
group_by(island) |>
mutate(position = row_number() - 1,
x = position %% 10,
y = position %/% 10) |>
ungroup()
## Each species named once, in its colour, above an island where it was sampled.
names_at <- tibble(species = c("Gentoo", "Chinstrap", "Adelie"),
island = c("Biscoe", "Dream", "Torgersen")) |>
left_join(units |> group_by(island) |> summarise(top = max(y)), by = "island") |>
mutate(x = 4.5, y = top + 2)
p <- ggplot(units, aes(x = x, y = y, colour = species)) +
geom_point(size = 1.3) +
geom_text(data = names_at, aes(label = species), size = 3.2) +
facet_wrap(~island, nrow = 1, strip.position = "bottom") +
scale_y_continuous(expand = expansion(mult = c(0.02, 0.04))) +
coord_fixed() +
labs(title = "Only Adelies were sampled on all three islands",
subtitle = "344 penguins of the Palmer Archipelago, one dot each",
x = NULL, y = NULL,
caption = "Data: palmerpenguins (Horst, Hill & Gorman 2020)") +
theme_lex_viz(grid = "", arrows = "") +
theme(legend.position = "none", axis.text = element_blank())Sources (17)
126 occurrences in the corpus; indexed by 3 books
Show the 17 sources
- Better data visualizations: a guide for scholars, researchers, and wonks
- Data Visualisation Guide, data.europa.eu
- Data visualisation: a handbook for data driven design
- Data visualization handbook
- Data Viz Project
- datavizproject.com
- Graphic presentation
- Information graphics
- Information Graphics: A Comprehensive Illustrated Reference
- La graphique et le traitement graphique de l'information
- Lagnel, Manuel de datavisualisation, Dunod, 2021
- Les fondamentaux de la visualisation de données
- Manuel de datavisualisation - 2e éd, vol. 2
- Questions in Dataviz: A Design-Driven Process for Data Visualisation
- Semiologie graphique: les diagrammes, les réseaux, les cartes.
- Semiology of graphics: diagrams, networks, maps
- Show me the numbers: designing tables and graphs to enlighten
Cite this entry
Stable addresshttps://dataviz.adrientaudiere.com/en/term/unit-chart.html
ReferenceTaudière Adrien. 2026. unit chart. In Visualization Vocabulary, version 1.0.0. IdEst. https://dataviz.adrientaudiere.com/en/term/unit-chart.html
BibTeX
@incollection{taudiere2026-unit-chart,
  author    = {Taudière, Adrien},
  title     = {unit chart},
  booktitle = {Visualization Vocabulary},
  year      = {2026},
  version   = {1.0.0},
  publisher = {IdEst},
  url       = {https://dataviz.adrientaudiere.com/en/term/unit-chart.html},
  note      = {CC0 1.0}
}Page created on 2026-10-13. Text last changed on 2026-11-02. Images last changed on 2026-11-11. Numbers computed on 2026-10-22.