
 graphique
 en code-barres
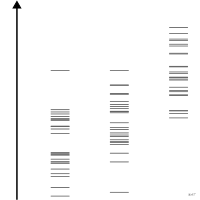
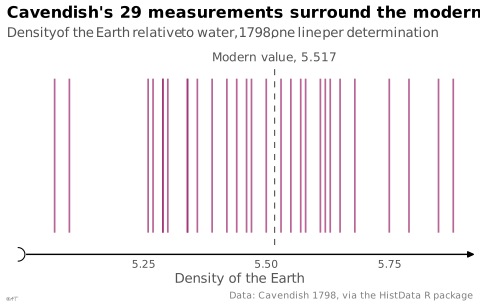
aussi : tracé de code à barresToutes les valeurs portées en traits fins sur un axe unique.
barcode plot
Every value drawn as a thin tick on a single axis.
Proche du diagramme en bandes, mais montre chaque observation plutôt qu'un résumé.
Classification
- graphique
- points et bulles › bandes de points
- distribution; Visual Vocabulary du Financial Times
- le nom évoque : objet
Canaux
 position sur une échelle commune; principal : valeur (trait fin)
Attestation
- terme français : Visual Vocabulary du Financial Times, version française↗
- définition anglaise : Visual Vocabulary du Financial Times
Littérature scientifique
OpenAlex : 15 articles depuis 2020, dont 67 % ces cinq dernières années; surtout en Biochemistry, Genetics and Molecular Biology, Computer Science, Medicine
Paquets R
- R
ggplot2::geom_rug(); GitHub 7 025 étoiles; dernier commit 2026-10; article (33 455 citations)
Code R de l'exemple ggplot2
library(ggplot2)
library(HistData)
## `density2` corrects a value that Cavendish read as 5.88 instead of 4.88.
p <- ggplot(Cavendish, aes(x = density2)) +
geom_segment(aes(xend = density2, y = 0, yend = 1), colour = "#9b2367", linewidth = 0.6, alpha = 0.7) +
annotate("segment", x = 5.517, xend = 5.517, y = -0.08, yend = 1.08, colour = "#535353", linewidth = 0.4,
linetype = "dashed") +
annotate("text", x = 5.517, y = 1.14, label = "Modern value, 5.517", size = 3.2, colour = "#535353") +
scale_x_continuous(labels = lex_number, breaks = lex_break_breaks, expand = lex_break_expand) +
scale_y_continuous(NULL, breaks = NULL) +
labs(title = "Cavendish's 29 measurements surround the modern value",
subtitle = "Density of the Earth relative to water, 1798, one line per determination",
x = "Density of the Earth",
caption = "Data: Cavendish 1798, via the HistData R package") +
theme_lex_viz(grid = "", arrows = "x", break_not_zero = "x")Sources (7)
5 occurrences dans le corpus
Citer cette fiche
Adresse stablehttps://dataviz.adrientaudiere.com/terme/barcode-plot.html
RéférenceTaudière Adrien. 2026. graphique en code-barres. Dans Visualization Vocabulary, version 1.0.0. IdEst. https://dataviz.adrientaudiere.com/terme/barcode-plot.html
BibTeX
@incollection{taudiere2026-barcode-plot,
  author    = {Taudière, Adrien},
  title     = {graphique en code-barres},
  booktitle = {Visualization Vocabulary},
  year      = {2026},
  version   = {1.0.0},
  publisher = {IdEst},
  url       = {https://dataviz.adrientaudiere.com/terme/barcode-plot.html},
  note      = {CC0 1.0}
}Fiche créée le 13/10/2026. Texte modifié le 22/10/2026. Images modifiées le 02/11/2026. Chiffres calculés le 22/10/2026.