
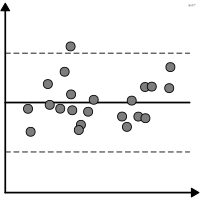
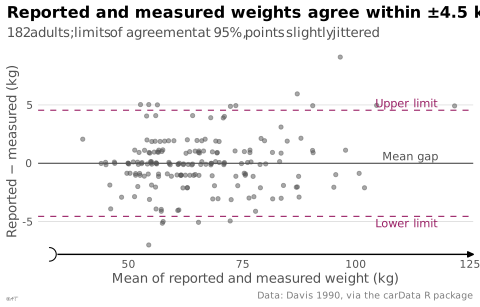

 graphique
 de Bland-Altman
Écart entre deux mesures contre leur moyenne.
Bland-Altman plot
Difference between two measurements against their mean.
Classification
- graphique
- points et bulles › nuages de points
- écart
- le nom évoque : nom de personne
Canaux
 position sur une échelle commune; principal : différence ; moyenne en abscisse
 longueur; secondaire : distance entre la moyenne et les points
Attestation
- terme français : Usage courant, non attesté par une source
Littérature scientifique
OpenAlex : 16 285 articles depuis 1956, dont 36 % ces cinq dernières années; surtout en Medicine, Health Professions, Engineering; Wikidata
Références séminales
- invention (1983) Altman & Bland (1983). Measurement in medicine: the analysis of method comparison studies. The Statistician (4 370 citations)
- diffusion (1986) Bland & Altman (1986). STATISTICAL METHODS FOR ASSESSING AGREEMENT BETWEEN TWO METHODS OF CLINICAL MEASUREMENT. The Lancet (48 302 citations)
Paquets R
Code R de l'exemple ggplot2
library(ggplot2)
library(dplyr)
library(carData)
## Record 12 has weight and height swapped (166 kg, 57 cm): left out.
weights <- Davis[-12, ] |>
filter(!is.na(repwt)) |>
mutate(mean = (weight + repwt) / 2, gap = repwt - weight)
bias <- mean(weights$gap)
limits <- bias + c(-1, 1) * qnorm(0.975) * sd(weights$gap)
p <- ggplot(weights, aes(x = mean, y = gap)) +
geom_hline(yintercept = bias, colour = "#535353", linewidth = 0.4) +
geom_hline(yintercept = limits, colour = "#9b2367", linewidth = 0.4, linetype = "dashed") +
geom_point(size = 1.2, alpha = 0.5, colour = "#535353", position = position_jitter(0.2, 0.15, seed = 1)) +
annotate("text", x = 118, y = limits + c(-0.6, 0.6), label = c("Lower limit", "Upper limit"),
hjust = 1, size = 3, colour = "#9b2367") +
annotate("text", x = 118, y = bias + 0.6, label = "Mean gap", hjust = 1, size = 3, colour = "#535353") +
scale_x_continuous(labels = lex_number, breaks = lex_break_breaks, expand = lex_break_expand) +
scale_y_continuous(labels = lex_number) +
labs(title = "Reported and measured weights agree within ±4.5 kg",
subtitle = "182 adults; limits of agreement at 95%, points slightly jittered",
x = "Mean of reported and measured weight (kg)", y = "Reported − measured (kg)",
caption = "Data: Davis 1990, via the carData R package") +
theme_lex_viz(grid = "y", arrows = "x", break_not_zero = "x")Sources (1)
Citer cette fiche
Adresse stablehttps://dataviz.adrientaudiere.com/terme/bland-altman.html
RéférenceTaudière Adrien. 2026. graphique de Bland-Altman. Dans Visualization Vocabulary, version 1.0.0. IdEst. https://dataviz.adrientaudiere.com/terme/bland-altman.html
BibTeX
@incollection{taudiere2026-bland-altman,
  author    = {Taudière, Adrien},
  title     = {graphique de Bland-Altman},
  booktitle = {Visualization Vocabulary},
  year      = {2026},
  version   = {1.0.0},
  publisher = {IdEst},
  url       = {https://dataviz.adrientaudiere.com/terme/bland-altman.html},
  note      = {CC0 1.0}
}Fiche créée le 13/10/2026. Texte modifié le 02/11/2026. Images modifiées le 12/11/2026. Chiffres calculés le 22/10/2026.