

 graphique
 à bulles
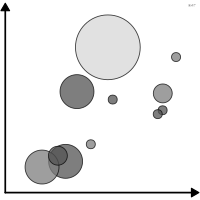
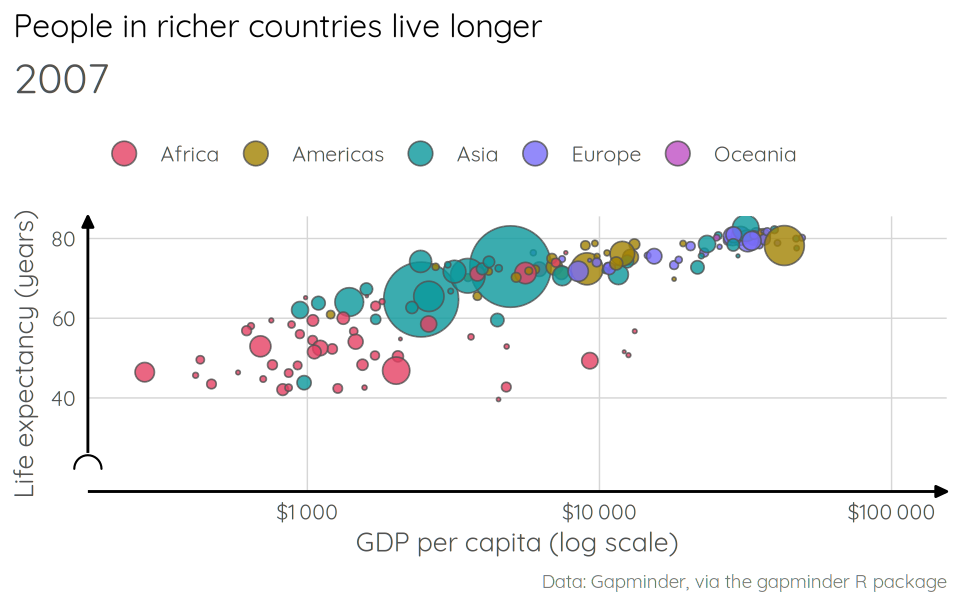
aussi : nuage de bulles, bulleNuage de points dont la taille code une troisième variable.
bubble chart
also: bubble plotScatterplot where size encodes a third variable.
Classification
- graphique
- points et bulles › nuages de points
- corrélation; Visual Vocabulary du Financial Times
- le nom évoque : nature
Canaux
 position sur une échelle commune; principal : deux variables quantitatives; Munzner 2014
 aire; principal : troisième variable; Munzner 2014
 teinte; secondaire : groupe; Munzner 2014
 mouvement; secondaire : année (version animée)
Attestation
- terme français : Lagnel, Manuel de datavisualisation, Dunod, 2021
- définition anglaise : Data Visualisation Guide, data.europa.eu
Littérature scientifique
OpenAlex : 977 articles depuis 1990, dont 59 % ces cinq dernières années; surtout en Medicine, Computer Science, Biochemistry, Genetics and Molecular Biology; Wikidata
Références séminales
- premier usage connu (1801) Playfair (1801). The Statistical Breviary; Andrews 2017, Ciuccarelli 2026
Paquets R
- R
nivo.bubblechart::bubblechart(); GitHub 4 étoiles; dernier commit 2026-01; article (0 citations) - R
ggBubbles::position_surround(); article (2 citations) Position qui range les points en petites bulles autour de leur valeur.
Code R de l'exemple ggplot2
set.seed(20260909)
library(ggplot2)
library(gganimate)
library(gapminder)
p <- ggplot(gapminder, aes(x = gdpPercap, y = lifeExp, size = pop, fill = continent)) +
geom_point(shape = 21, colour = "#535353", alpha = 0.8) +
scale_x_log10(labels = scales::label_dollar(big.mark = "\u2009")) +
scale_y_continuous(breaks = lex_break_breaks, expand = lex_break_expand) +
scale_size_area(max_size = 14, guide = "none") +
scale_fill_manual(values = continent_colors) +
guides(fill = guide_legend(override.aes = list(size = 4))) +
labs(title = "People in richer countries live longer",
subtitle = "{round(frame_time)}",
x = "GDP per capita (log scale)",
y = "Life expectancy (years)", fill = NULL,
caption = "Data: Gapminder, via the gapminder R package") +
theme_lex_viz(break_not_zero = "y") +
theme(plot.subtitle = ggtext::element_textbox_simple(size = 16, margin = margin(b = 6))) +
transition_time(year) +
ease_aes("linear")Sources (48)
191 occurrences dans le corpus; indexé par 15 ouvrages
Afficher les 48 sources
- analysisfunction.civilservice.gov.uk
- app.flourish.studio
- Atlas of knowledge: anyone can map
- Better data visualizations: a guide for scholars, researchers, and wonks
- Bremer & Barone, Chart, CRC Press, 2025
- Data fluency: empowering your organization with effective data communication
- Data points: visualization that means something
- Data story: explain data and inspire action through story
- Data Visualisation Guide, data.europa.eu
- Data visualisation: a handbook for data driven design
- Data visualization handbook
- Data Viz Project
- Data-driven storytelling
- datavizcatalogue.com
- datavizproject.com
- datawrapper.de↗
- Effective data storytelling: how to drive change with data, narrative, and visuals
- Effective data visualization: the right chart for the right data
- Exploratory Data Analysis: Descriptive Analysis, Visualization, and Dashboard Design (w...
- Friendly & Wainer, A History of Data Visualization and Graphic Communication, Harvard University Press, 2021
- Graphiques : vocabulaire, EBSI Montréal (d'après le GDT)↗
- Handling and mapping geographic information
- How charts lie: getting smarter about visual information
- Info we trust: how to inspire the world with data
- Information graphics
- Lagnel, Manuel de datavisualisation, Dunod, 2021
- Les fondamentaux de la visualisation de données
- Manuel de datavisualisation - 2e éd, vol. 2
- More Practical Charts
- Practical charts: the essential guide to creating clear, compelling charts for reports ...
- pudding.cool↗
- Questions in Dataviz: A Design-Driven Process for Data Visualisation
- Show me the numbers: designing tables and graphs to enlighten
- The art of insight: how great visualization designers think
- The big book of dashboards: visualizing your data using real-world business scenarios
- The functional art: an introduction to information graphics and visualization
- The golden age of data visualization: how did we get here?
- The grammar of graphics
- The Truthful Art: Data, Charts, and Maps for Communication
- Thematic Cartography and Geovisualization
- Visualization Analysis and Design
- Visualize This
- Visualizing with text
- Wikipedia — Data and information visualization
- Wikipédia — Visualisation de données
- Wikipédia en français↗
- Wikipedia in English↗
- Wilke, Fundamentals of Data Visualization, O'Reilly, 2019
Citer cette fiche
Adresse stablehttps://dataviz.adrientaudiere.com/terme/bubble-chart.html
RéférenceTaudière Adrien. 2026. graphique à bulles. Dans Visualization Vocabulary, version 1.0.0. IdEst. https://dataviz.adrientaudiere.com/terme/bubble-chart.html
BibTeX
@incollection{taudiere2026-bubble-chart,
  author    = {Taudière, Adrien},
  title     = {graphique à bulles},
  booktitle = {Visualization Vocabulary},
  year      = {2026},
  version   = {1.0.0},
  publisher = {IdEst},
  url       = {https://dataviz.adrientaudiere.com/terme/bubble-chart.html},
  note      = {CC0 1.0}
}Fiche créée le 13/10/2026. Texte modifié le 12/11/2026. Images modifiées le 12/11/2026. Chiffres calculés le 22/10/2026.