
 graphique
 en puce
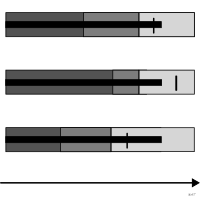
Barre unique comparée à une cible et à des plages de référence.
bullet graph
also: bullet chartSingle bar compared to a target and reference bands.
Alternative compacte à la jauge.
Classification
- graphique
- barres › barres d'étendue et de repère
- grandeur; Visual Vocabulary du Financial Times
- le nom évoque : objet
Canaux
 position sur une échelle commune; principal : valeur mesurée et cible
 longueur; principal : valeur mesurée
 luminance; secondaire : plages qualitatives (bandes de gris)
 saturation; secondaire : plages qualitatives (à la place de la luminance)
Attestation
- terme français : Usage courant, non attesté par une source
Littérature scientifique
OpenAlex : 40 articles depuis 2000, dont 22 % ces cinq dernières années; surtout en Computer Science, Mathematics, Business, Management and Accounting; Wikidata
Références séminales
- invention (2006) Few (2006). Information Dashboard Design. O'Reilly; Wikipedia in English
Paquets R
- R
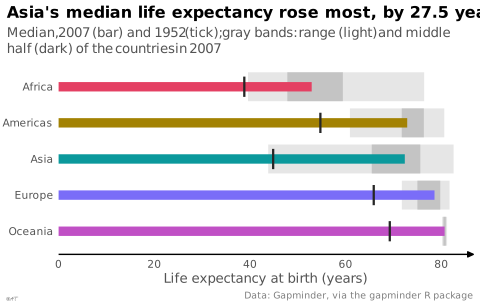
ggplot2::geom_col(); GitHub 7 025 étoiles; dernier commit 2026-10; article (33 455 citations) Barres superposées : plages en fond, valeur en barre étroite, cible en trait (geom_errorbar).
Code R de l'exemple ggplot2
library(ggplot2)
library(dplyr)
library(gapminder)
## One bullet per continent: the 2007 median life expectancy (bar), the 1952
## median (tick) and, behind them, the spread of its countries in 2007: full
## range (light band) and interquartile range (dark band).
bullets <- gapminder |>
filter(year %in% c(1952, 2007)) |>
group_by(continent) |>
summarise(median_2007 = median(lifeExp[year == 2007]),
median_1952 = median(lifeExp[year == 1952]),
min = min(lifeExp[year == 2007]), max = max(lifeExp[year == 2007]),
q1 = quantile(lifeExp[year == 2007], 0.25), q3 = quantile(lifeExp[year == 2007], 0.75)) |>
mutate(continent = factor(continent, levels = rev(levels(continent))), y = as.numeric(continent))
p <- ggplot(bullets) +
geom_rect(aes(xmin = min, xmax = max, ymin = y - 0.4, ymax = y + 0.4), fill = "#e6e6e6") +
geom_rect(aes(xmin = q1, xmax = q3, ymin = y - 0.4, ymax = y + 0.4), fill = "#c4c4c4") +
geom_rect(aes(xmin = 0, xmax = median_2007, ymin = y - 0.13, ymax = y + 0.13, fill = continent)) +
geom_segment(aes(x = median_1952, xend = median_1952, y = y - 0.28, yend = y + 0.28),
colour = "#262626", linewidth = 0.8) +
scale_fill_manual(values = continent_colors) +
scale_x_continuous(limits = c(0, 85), breaks = seq(0, 80, 20), expand = expansion(mult = c(0, 0.02))) +
scale_y_continuous(breaks = bullets$y, labels = bullets$continent) +
labs(title = "Asia's median life expectancy rose most, by 27.5 years",
subtitle = "Median, 2007 (bar) and 1952 (tick); gray bands: range (light) and middle half (dark) of the countries in 2007",
x = "Life expectancy at birth (years)", y = NULL,
caption = "Data: Gapminder, via the gapminder R package") +
theme_lex_viz(grid = "", arrows = "x") +
theme(legend.position = "none")Sources (10)
49 occurrences dans le corpus; indexé par 5 ouvrages
- Better data visualizations: a guide for scholars, researchers, and wonks
- Data fluency: empowering your organization with effective data communication
- Data visualisation: a handbook for data driven design
- Data Viz Project
- datavizproject.com
- Effective data visualization: the right chart for the right data
- Practical charts: the essential guide to creating clear, compelling charts for reports ...
- The big book of dashboards: visualizing your data using real-world business scenarios
- The Truthful Art: Data, Charts, and Maps for Communication
- Wikipedia in English↗
Citer cette fiche
Adresse stablehttps://dataviz.adrientaudiere.com/terme/bullet-graph.html
RéférenceTaudière Adrien. 2026. graphique en puce. Dans Visualization Vocabulary, version 1.0.0. IdEst. https://dataviz.adrientaudiere.com/terme/bullet-graph.html
BibTeX
@incollection{taudiere2026-bullet-graph,
  author    = {Taudière, Adrien},
  title     = {graphique en puce},
  booktitle = {Visualization Vocabulary},
  year      = {2026},
  version   = {1.0.0},
  publisher = {IdEst},
  url       = {https://dataviz.adrientaudiere.com/terme/bullet-graph.html},
  note      = {CC0 1.0}
}Fiche créée le 13/10/2026. Texte modifié le 12/11/2026. Images modifiées le 12/11/2026. Chiffres calculés le 22/10/2026.