
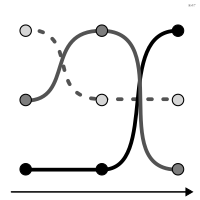
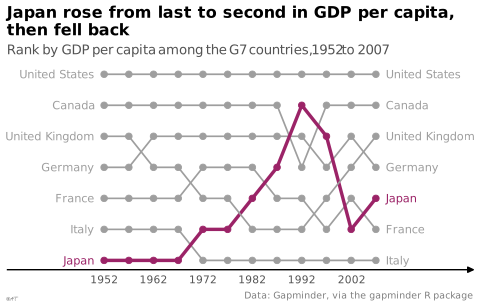
 graphique
 de classement
aussi : bump chartÉvolution du rang de plusieurs entités au cours du temps.
bump chart
also: ranking chartChange in rank of several entities over time.
Pas de terme français stabilisé.
Classification
- graphique
- courbes et aires › courbes
- classement; Visual Vocabulary du Financial Times
Canaux
 position sur une échelle commune; principal : rang
 inclinaison ou angle; secondaire : changement de rang
 teinte; principal : série
 forme; secondaire : série
Attestation
- terme français : Usage courant, non attesté par une source
- définition anglaise : Data Visualisation Guide, data.europa.eu
Littérature scientifique
OpenAlex : 29 articles depuis 2017, dont 48 % ces cinq dernières années; surtout en Computer Science, Social Sciences, Environmental Science
Références séminales
- diffusion (1990) Tufte (1990). Envisioning Information. Graphics Press; Envisioning information, Beautiful evidence
Paquets R
- R
ggbump::geom_bump(); GitHub 580 étoiles; dernier commit 2025-09 Retiré du CRAN : à installer depuis GitHub.
Code R de l'exemple ggplot2
library(ggplot2)
library(dplyr)
library(gapminder)
ranks <- gapminder |>
filter(country %in% c("Canada", "France", "Germany", "Italy", "Japan",
"United Kingdom", "United States")) |>
group_by(year) |>
mutate(rank = rank(-gdpPercap)) |>
ungroup() |>
mutate(japan = country == "Japan")
p <- ggplot(ranks, aes(x = year, y = rank, group = country, colour = japan)) +
geom_line(aes(linewidth = japan)) +
geom_point(size = 2) +
geom_text(data = filter(ranks, year == min(year)), aes(label = country),
hjust = 1, nudge_x = -2, size = 3) +
geom_text(data = filter(ranks, year == max(year)), aes(label = country),
hjust = 0, nudge_x = 2, size = 3) +
scale_x_continuous(breaks = seq(1952, 2007, 10), expand = expansion(mult = 0.3)) +
scale_y_reverse(NULL, breaks = NULL) +
scale_colour_manual(values = c("#9e9e9e", "#9b2367")) +
scale_linewidth_manual(values = c(0.6, 1.2)) +
labs(title = "Japan rose from last to second in GDP per capita,\nthen fell back",
subtitle = "Rank by GDP per capita among the G7 countries, 1952 to 2007",
x = NULL,
caption = "Data: Gapminder, via the gapminder R package") +
theme_lex_viz(grid = "", arrows = "x") +
theme(legend.position = "none")Sources (16)
66 occurrences dans le corpus; indexé par 4 ouvrages
Afficher les 16 sources
- app.flourish.studio
- Better data visualizations: a guide for scholars, researchers, and wonks
- Bremer & Barone, Chart, CRC Press, 2025
- Data sketches
- Data Visualisation Guide, data.europa.eu
- Data visualisation: a handbook for data driven design
- Data Viz Project
- datavizproject.com
- Effective data visualization: the right chart for the right data
- Information Graphics: A Comprehensive Illustrated Reference
- Open Visualization Academy, cours et lettre d'information (Cairo et al.)
- Questions in Dataviz: A Design-Driven Process for Data Visualisation
- The big book of dashboards: visualizing your data using real-world business scenarios
- Visualize This
- Visualizing with text
- xeno.graphics↗
Citer cette fiche
Adresse stablehttps://dataviz.adrientaudiere.com/terme/bump-chart.html
RéférenceTaudière Adrien. 2026. graphique de classement. Dans Visualization Vocabulary, version 1.0.0. IdEst. https://dataviz.adrientaudiere.com/terme/bump-chart.html
BibTeX
@incollection{taudiere2026-bump-chart,
  author    = {Taudière, Adrien},
  title     = {graphique de classement},
  booktitle = {Visualization Vocabulary},
  year      = {2026},
  version   = {1.0.0},
  publisher = {IdEst},
  url       = {https://dataviz.adrientaudiere.com/terme/bump-chart.html},
  note      = {CC0 1.0}
}Fiche créée le 13/10/2026. Texte modifié le 12/11/2026. Images modifiées le 12/11/2026. Chiffres calculés le 22/10/2026.