
 graphique
calendrier thermique
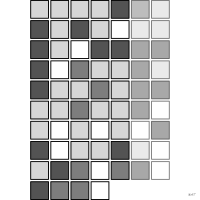
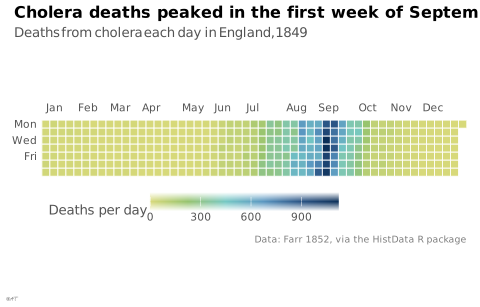
aussi : calendrier coloréGrille calendaire dont chaque jour est coloré selon une valeur.
calendar heatmap
Calendar grid where each day is colored by a value.
Classification
- graphique
- matrices et tableaux › matrices colorées
- évolution dans le temps; Visual Vocabulary du Financial Times
- le nom évoque : nature, objet
Canaux
 luminance; principal : valeur du jour
 saturation; principal : valeur du jour (à la place de la luminance)
 région de l'espace; principal : jour, semaine, mois (grille du calendrier)
Attestation
- terme français : Usage courant, non attesté par une source
- définition anglaise : Data Visualisation Guide, data.europa.eu
Littérature scientifique
OpenAlex : 14 articles depuis 2020, dont 50 % ces cinq dernières années; surtout en Computer Science, Business, Management and Accounting, Engineering
Références séminales
Paquets R
- R
openair::calendarPlot(); GitHub 368 étoiles; dernier commit 2026-11; article (2 011 citations)
Code R de l'exemple ggplot2
library(ggplot2)
library(dplyr)
library(HistData)
## One column per week, Monday first.
cholera <- CholeraDeaths1849 |>
filter(cause_of_death == "Cholera") |>
mutate(week = as.integer(format(date, "%W")),
month = month.abb[as.integer(format(date, "%m"))])
firsts <- cholera |>
filter(day_of_month == "1")
p <- ggplot(cholera, aes(x = week, y = day_of_week, fill = deaths)) +
geom_tile(colour = "white", linewidth = 0.3) +
scale_x_continuous(breaks = firsts$week, labels = firsts$month, expand = c(0, 0), position = "top") +
scale_y_discrete(limits = rev, labels = \(d) ifelse(d %in% c("Mon", "Wed", "Fri"), d, "")) +
scale_fill_continuous(labels = lex_number) +
coord_equal() +
labs(title = "Cholera deaths peaked in the first week of September",
subtitle = "Deaths from cholera each day in England, 1849",
x = NULL, y = NULL, fill = "Deaths per day",
caption = "Data: Farr 1852, via the HistData R package") +
theme_lex_viz(grid = "", arrows = "") +
theme(legend.position = "bottom", legend.key.width = unit(10, "mm"), legend.key.height = unit(2.5, "mm"),
axis.text.x = element_text(hjust = 0))Sources (3)
1 occurrence dans le corpus
Citer cette fiche
Adresse stablehttps://dataviz.adrientaudiere.com/terme/calendar-heatmap.html
RéférenceTaudière Adrien. 2026. calendrier thermique. Dans Visualization Vocabulary, version 1.0.0. IdEst. https://dataviz.adrientaudiere.com/terme/calendar-heatmap.html
BibTeX
@incollection{taudiere2026-calendar-heatmap,
  author    = {Taudière, Adrien},
  title     = {calendrier thermique},
  booktitle = {Visualization Vocabulary},
  year      = {2026},
  version   = {1.0.0},
  publisher = {IdEst},
  url       = {https://dataviz.adrientaudiere.com/terme/calendar-heatmap.html},
  note      = {CC0 1.0}
}Fiche créée le 13/10/2026. Texte modifié le 22/10/2026. Images modifiées le 12/11/2026. Chiffres calculés le 22/10/2026.