
 graphique
nuage de points connecté
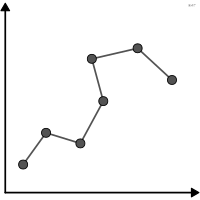
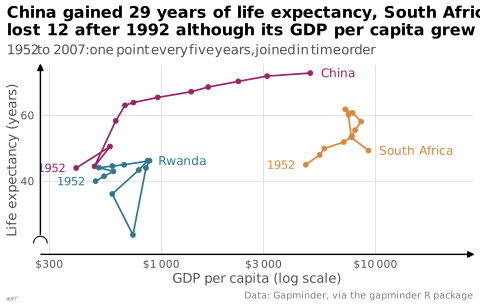
aussi : nuage de points connectésNuage de points dont les points sont reliés dans l'ordre temporel.
connected scatterplot
also: connected scatter plotScatterplot whose points are joined in time order.
Classification
- graphique
- points et bulles › nuages de points
- corrélation, évolution dans le temps; Visual Vocabulary du Financial Times
- le nom évoque : nature
Canaux
 position sur une échelle commune; principal : deux variables quantitatives
 inclinaison ou angle; secondaire : sens de l'évolution (direction des segments)
Attestation
- terme français : Visual Vocabulary du Financial Times, version française↗
- définition anglaise : Data Visualisation Guide, data.europa.eu
Littérature scientifique
OpenAlex : 15 articles depuis 2015, dont 27 % ces cinq dernières années; surtout en Computer Science, Environmental Science, Business, Management and Accounting
Références séminales
Paquets R
- R
ggplot2::geom_path(); GitHub 7 025 étoiles; dernier commit 2026-10; article (33 455 citations) Relie les points dans l'ordre des données.
Code R de l'exemple ggplot2
library(ggplot2)
library(dplyr)
library(gapminder)
countries <- gapminder |>
filter(country %in% c("China", "Rwanda", "South Africa")) |>
arrange(country, year)
ends <- countries |>
filter(year %in% range(year))
p <- ggplot(countries, aes(x = gdpPercap, y = lifeExp, colour = country)) +
geom_path(linewidth = 0.6) +
geom_point(size = 1.4) +
geom_text(data = filter(ends, year == max(year)), aes(label = country),
hjust = 0, nudge_x = 0.05, size = 3.2) +
geom_text(data = filter(ends, year == min(year)), aes(label = year),
hjust = 1, nudge_x = -0.05, size = 3) +
scale_x_log10(labels = scales::label_dollar(accuracy = 1, big.mark = "\u2009"),
expand = expansion(mult = c(0.08, 0.3))) +
scale_y_continuous(labels = lex_number, breaks = lex_break_breaks, expand = lex_break_expand) +
labs(title = "China gained 29 years of life expectancy, South Africa\nlost 12 after 1992 although its GDP per capita grew",
subtitle = "1952 to 2007: one point every five years, joined in time order",
x = "GDP per capita (log scale)", y = "Life expectancy (years)",
caption = "Data: Gapminder, via the gapminder R package") +
theme_lex_viz(break_not_zero = "y") +
theme(legend.position = "none")Sources (12)
50 occurrences dans le corpus; indexé par 7 ouvrages
Afficher les 12 sources
- Better data visualizations: a guide for scholars, researchers, and wonks
- Data Visualisation Guide, data.europa.eu
- Data visualisation: a handbook for data driven design
- Data visualization: a practical introduction
- Effective data visualization: the right chart for the right data
- How charts lie: getting smarter about visual information
- Info we trust: how to inspire the world with data
- More Practical Charts
- The Truthful Art: Data, Charts, and Maps for Communication
- Visual Vocabulary du Financial Times, version française↗
- Visualization of Time-Oriented Data
- Wilke, Fundamentals of Data Visualization, O'Reilly, 2019
Citer cette fiche
Adresse stablehttps://dataviz.adrientaudiere.com/terme/connected-scatterplot.html
RéférenceTaudière Adrien. 2026. nuage de points connecté. Dans Visualization Vocabulary, version 1.0.0. IdEst. https://dataviz.adrientaudiere.com/terme/connected-scatterplot.html
BibTeX
@incollection{taudiere2026-connected-scatterplot,
  author    = {Taudière, Adrien},
  title     = {nuage de points connecté},
  booktitle = {Visualization Vocabulary},
  year      = {2026},
  version   = {1.0.0},
  publisher = {IdEst},
  url       = {https://dataviz.adrientaudiere.com/terme/connected-scatterplot.html},
  note      = {CC0 1.0}
}Fiche créée le 13/10/2026. Texte modifié le 12/11/2026. Images modifiées le 12/11/2026. Chiffres calculés le 22/10/2026.