

 graphique
autocorrélogramme
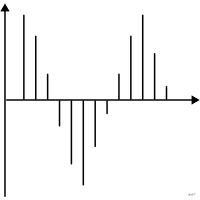
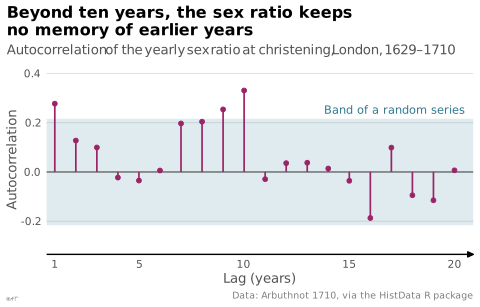
Autocorrélation d'une série tracée en fonction du décalage.
correlogram
also: autocorrelation plot, ACF plotAutocorrelation of a series plotted against the lag.
Faux-ami : en français corrélogramme désigne ici la matrice de corrélations (voir corrgram).
Classification
- graphique
- courbes et aires › courbes statistiques
Canaux
 position sur une échelle commune; principal : autocorrélation ; décalage en abscisse
 longueur; principal : valeur de l'autocorrélation
Attestation et synonymies
- terme français : Usage courant, non attesté par une source
- corrélogramme; Wikipédia en français↗
Littérature scientifique
Paquets R
- R
forecast::ggAcf(); GitHub 1 186 étoiles; dernier commit 2026-11; article (3 547 citations) - R
stats::acf()R de base.
Code R de l'exemple ggplot2
library(ggplot2)
library(HistData)
## Ratio of male to female christenings in London, one value a year.
ratio <- Arbuthnot$Males / Arbuthnot$Females
lags <- acf(ratio, lag.max = 20, plot = FALSE)
acf_lags <- data.frame(lag = lags$lag[-1], r = lags$acf[-1])
## 95% band of a series without autocorrelation.
band <- qnorm(0.975) / sqrt(length(ratio))
p <- ggplot(acf_lags, aes(x = lag, y = r)) +
annotate("rect", xmin = -Inf, xmax = Inf, ymin = -band, ymax = band, fill = "#2e7891", alpha = 0.15) +
geom_hline(yintercept = 0, colour = "#535353", linewidth = 0.4) +
geom_segment(aes(xend = lag, yend = 0), linewidth = 0.6, colour = "#9b2367") +
geom_point(size = 1.4, colour = "#9b2367") +
annotate("text", x = 20.5, y = band + 0.02, label = "Band of a random series", colour = "#2e7891",
hjust = 1, vjust = 0, size = 3) +
scale_x_continuous(breaks = c(1, 5, 10, 15, 20), expand = expansion(mult = 0.02)) +
scale_y_continuous(labels = lex_number, limits = c(-0.3, 0.4)) +
labs(title = "Beyond ten years, the sex ratio keeps\nno memory of earlier years",
subtitle = "Autocorrelation of the yearly sex ratio at christening, London, 1629–1710",
x = "Lag (years)", y = "Autocorrelation",
caption = "Data: Arbuthnot 1710, via the HistData R package") +
theme_lex_viz(grid = "y", arrows = "x")Sources (9)
17 occurrences dans le corpus; indexé par 1 ouvrage
- Applied Multivariate Statistics in R
- Data visualisation: a handbook for data driven design
- data-to-viz.com
- Exploratory Data Analysis: Descriptive Analysis, Visualization, and Dashboard Design (w...
- From data to viz
- python-graph-gallery.com
- The grammar of graphics
- Wikipedia in English↗
- Wilke, Fundamentals of Data Visualization, O'Reilly, 2019
Citer cette fiche
Adresse stablehttps://dataviz.adrientaudiere.com/terme/correlogram.html
RéférenceTaudière Adrien. 2026. autocorrélogramme. Dans Visualization Vocabulary, version 1.0.0. IdEst. https://dataviz.adrientaudiere.com/terme/correlogram.html
BibTeX
@incollection{taudiere2026-correlogram,
  author    = {Taudière, Adrien},
  title     = {autocorrélogramme},
  booktitle = {Visualization Vocabulary},
  year      = {2026},
  version   = {1.0.0},
  publisher = {IdEst},
  url       = {https://dataviz.adrientaudiere.com/terme/correlogram.html},
  note      = {CC0 1.0}
}Fiche créée le 13/10/2026. Texte modifié le 02/11/2026. Images modifiées le 12/11/2026. Chiffres calculés le 22/10/2026.