
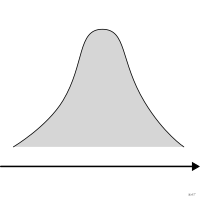
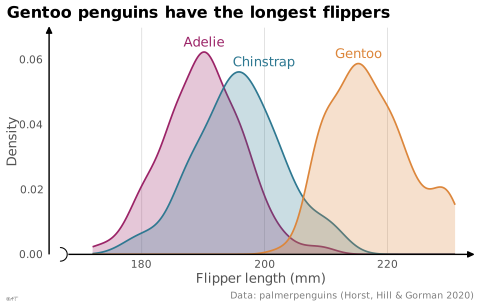
 graphique
courbe de densité
Estimation lissée de la distribution d'une variable continue.
density plot
also: kernel density plotSmoothed estimate of a continuous variable's distribution.
Classification
- graphique
- courbes et aires › courbes statistiques
- distribution
Canaux
 position sur une échelle commune; principal : densité
 aire; secondaire : probabilité (aire sous la courbe)
Variantes
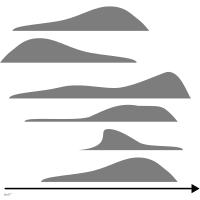 graphique en crêtesdécalé par groupe
Attestation
- terme français : Larmarange, guide-R : guide pour l'analyse de données d'enquêtes avec R
- définition anglaise : Data Visualisation Guide, data.europa.eu
Littérature scientifique
OpenAlex : 3 466 articles depuis 1960, dont 38 % ces cinq dernières années; surtout en Physics and Astronomy, Engineering, Medicine
Références séminales
- formalisation (1956) Rosenblatt (1956). Remarks on some nonparametric estimates of a density function. The Annals of Mathematical Statistics (4 703 citations); Wikipedia in English
Paquets R
- R
ggplot2::geom_density(); GitHub 7 025 étoiles; dernier commit 2026-10; article (33 455 citations) - R
ggpointdensity::geom_pointdensity(); GitHub 455 étoiles; dernier commit 2025-11; article (27 citations)
Code R de l'exemple ggplot2
library(ggplot2)
library(dplyr)
library(palmerpenguins)
flippers <- penguins |>
filter(!is.na(flipper_length_mm))
peaks <- flippers |>
group_by(species) |>
summarise(d = list(density(flipper_length_mm))) |>
mutate(x = sapply(d, \(d) d$x[which.max(d$y)]),
## Moved right, off the Adelie curve.
x = x + ifelse(species == "Chinstrap", 4, 0),
y = sapply(d, \(d) max(d$y)))
p <- ggplot(flippers, aes(x = flipper_length_mm, colour = species, fill = species)) +
geom_density(alpha = 0.25, linewidth = 0.6) +
geom_text(data = peaks, aes(x = x, y = y, label = species), vjust = -0.6, size = 3.5) +
scale_x_continuous(labels = lex_number, breaks = lex_break_breaks, expand = lex_break_expand) +
scale_y_continuous(expand = expansion(mult = c(0, 0.12))) +
labs(title = "Gentoo penguins have the longest flippers",
x = "Flipper length (mm)", y = "Density",
caption = "Data: palmerpenguins (Horst, Hill & Gorman 2020)") +
theme_lex_viz(grid = "x", break_not_zero = "x") +
theme(legend.position = "none")Sources (23)
43 occurrences dans le corpus; indexé par 3 ouvrages
Afficher les 23 sources
- Computational statistics in data science
- Cook & Laa, Interactively Exploring High-Dimensional Data and Models in R, Chapman & Hall/CRC, 2026
- Data points: visualization that means something
- Data Visualisation Guide, data.europa.eu
- Data visualisation: a handbook for data driven design
- data-to-viz.com
- Exploratory Data Analysis: Descriptive Analysis, Visualization, and Dashboard Design (w...
- From data to viz
- Grosjean & Engels, Science des données biologiques I-III (Université de Mons)
- Larmarange et al., analyse-R : introduction à l'analyse d'enquêtes avec R
- Larmarange, guide-R : guide pour l'analyse de données d'enquêtes avec R
- LibreTexts Statistics, chapitres de manuels sur les figures
- Magrit, manuel d'utilisation (UAR RIATE, CNRS)
- More Practical Charts
- Open Visualization Academy, cours et lettre d'information (Cairo et al.)
- Progressive Data Analysis: Roadmap and Research Agenda
- Rakotomalala, fascicules de cours de statistique (Université Lyon 2)
- utilitR, documentation collaborative sur R (Insee)
- Visualization of Time-Oriented Data
- Visualize This
- Wickham, Çetinkaya-Rundel & Grolemund, R for Data Science, 2e éd., 2023
- Wickham, Navarro & Pedersen, ggplot2: Elegant Graphics for Data Analysis, 3e éd. en ligne↗
- Wilke, Fundamentals of Data Visualization, O'Reilly, 2019
Citer cette fiche
Adresse stablehttps://dataviz.adrientaudiere.com/terme/density-plot.html
RéférenceTaudière Adrien. 2026. courbe de densité. Dans Visualization Vocabulary, version 1.0.0. IdEst. https://dataviz.adrientaudiere.com/terme/density-plot.html
BibTeX
@incollection{taudiere2026-density-plot,
  author    = {Taudière, Adrien},
  title     = {courbe de densité},
  booktitle = {Visualization Vocabulary},
  year      = {2026},
  version   = {1.0.0},
  publisher = {IdEst},
  url       = {https://dataviz.adrientaudiere.com/terme/density-plot.html},
  note      = {CC0 1.0}
}Fiche créée le 13/10/2026. Texte modifié le 22/10/2026. Images modifiées le 12/11/2026. Chiffres calculés le 22/10/2026.