
 graphique
courbe dose-réponse
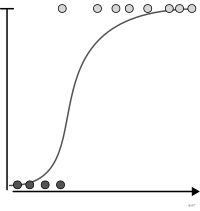
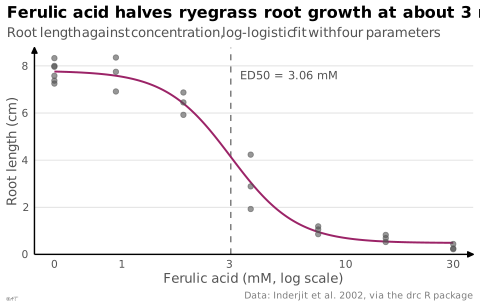
Courbe de la réponse mesurée en fonction de la dose administrée.
dose-response curve
Curve of the measured response as a function of the administered dose.
Wilke la range avec les séries temporelles : l'abscisse est une grandeur strictement croissante.
Classification
- graphique
- courbes et aires › courbes statistiques
- corrélation
Canaux
 position sur une échelle commune; principal : réponse ; dose en abscisse
 inclinaison ou angle; secondaire : forme de la réponse (pente de la sigmoïde)
Attestation
- terme français : Usage courant, non attesté par une source
- définition anglaise : Wilke, Fundamentals of Data Visualization, O'Reilly, 2019
Références séminales
- formalisation (1927) Trevan (1927). The error of determination of toxicity. Proceedings of the Royal Society of London. Series B (400 citations)
Code R de l'exemple ggplot2
library(ggplot2)
library(drc)
## Four-parameter log-logistic model of ryegrass root length against the
## concentration of ferulic acid; ED50, the dose that halves the response.
data(ryegrass)
model <- drm(rootl ~ conc, data = ryegrass, fct = LL.4())
ed50 <- ED(model, 50, display = FALSE)[1, "Estimate"]
curve <- data.frame(conc = exp(seq(log(0.5), log(30), length.out = 200)))
curve$rootl <- predict(model, newdata = curve)
## Zero cannot sit on a log axis: the control is drawn at 0.5 and labelled 0.
ryegrass$x <- pmax(ryegrass$conc, 0.5)
p <- ggplot(ryegrass, aes(x = x, y = rootl)) +
geom_vline(xintercept = ed50, colour = "#535353", linewidth = 0.4, linetype = "dashed") +
geom_line(data = curve, aes(x = conc), colour = "#9b2367", linewidth = 0.7) +
geom_point(size = 1.6, alpha = 0.6, colour = "#535353") +
annotate("text", x = ed50 * 1.1, y = 7.6, hjust = 0, size = 3, colour = "#535353",
label = paste0("ED50 = ", format(round(ed50, 2), nsmall = 2), " mM")) +
scale_x_log10(breaks = c(0.5, 1, 3, 10, 30), labels = c("0", "1", "3", "10", "30")) +
scale_y_continuous(labels = lex_number, limits = c(0, NA), expand = expansion(mult = c(0, 0.05))) +
labs(title = "Ferulic acid halves ryegrass root growth at about 3 mM",
subtitle = "Root length against concentration, log-logistic fit with four parameters",
x = "Ferulic acid (mM, log scale)", y = "Root length (cm)",
caption = "Data: Inderjit et al. 2002, via the drc R package") +
theme_lex_viz(grid = "y", arrows = "xy")Sources (2)
Citer cette fiche
Adresse stablehttps://dataviz.adrientaudiere.com/terme/dose-response-curve.html
RéférenceTaudière Adrien. 2026. courbe dose-réponse. Dans Visualization Vocabulary, version 1.0.0. IdEst. https://dataviz.adrientaudiere.com/terme/dose-response-curve.html
BibTeX
@incollection{taudiere2026-dose-response-curve,
  author    = {Taudière, Adrien},
  title     = {courbe dose-réponse},
  booktitle = {Visualization Vocabulary},
  year      = {2026},
  version   = {1.0.0},
  publisher = {IdEst},
  url       = {https://dataviz.adrientaudiere.com/terme/dose-response-curve.html},
  note      = {CC0 1.0}
}Fiche créée le 13/10/2026. Texte modifié le 02/11/2026. Images modifiées le 02/11/2026. Chiffres calculés le 22/10/2026.