
 graphique
 haltère
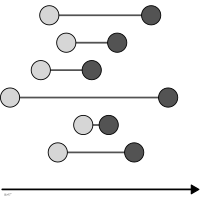
Deux points reliés montrant l'écart entre deux états.
dumbbell chart
also: connected dot plotTwo joined dots showing the gap between two states.
Classification
- graphique
- points et bulles › points et intervalles
- écart, évolution dans le temps
- le nom évoque : objet
Canaux
 position sur une échelle commune; principal : valeur des deux états
 longueur; secondaire : écart (segment entre les points)
 région de l'espace; principal : catégorie
 teinte; principal : série
Attestation
- terme français : Usage courant, non attesté par une source
- définition anglaise : Data Visualisation Guide, data.europa.eu
Littérature scientifique
OpenAlex : 13 articles depuis 2023, dont 69 % ces cinq dernières années; surtout en Computer Science, Mathematics, Economics, Econometrics and Finance
Paquets R
- R
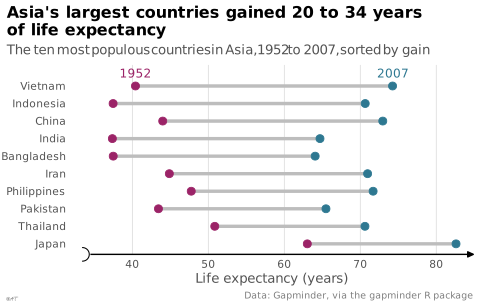
ggplot2::geom_segment(); GitHub 7 025 étoiles; dernier commit 2026-10; article (33 455 citations) Un segment par catégorie entre les deux valeurs, avec geom_point aux extrémités.
Code R de l'exemple ggplot2
library(ggplot2)
library(dplyr)
library(tidyr)
library(gapminder)
## The ten most populous countries of Asia in 2007.
largest <- gapminder |>
filter(continent == "Asia", year == 2007) |>
slice_max(pop, n = 10) |>
pull(country)
life <- gapminder |>
filter(country %in% largest, year %in% c(1952, 2007)) |>
select(country, year, lifeExp) |>
pivot_wider(names_from = year, values_from = lifeExp, names_prefix = "y") |>
mutate(country = reorder(droplevels(country), y2007 - y1952))
ends <- life |>
pivot_longer(c(y1952, y2007), names_to = "year", values_to = "lifeExp") |>
mutate(year = sub("y", "", year))
p <- ggplot(life, aes(y = country)) +
geom_segment(aes(x = y1952, xend = y2007, yend = country), colour = "#bdbdbd", linewidth = 1.2) +
geom_point(data = ends, aes(x = lifeExp, colour = year), size = 2.5) +
geom_text(data = filter(ends, country == last(levels(life$country))),
aes(x = lifeExp, label = year, colour = year), vjust = -1, size = 3.2) +
scale_x_continuous(labels = lex_number, breaks = lex_break_breaks, expand = lex_break_expand) +
scale_y_discrete(expand = expansion(add = c(0.6, 1.2))) +
labs(title = "Asia's largest countries gained 20 to 34 years\nof life expectancy",
subtitle = "The ten most populous countries in Asia, 1952 to 2007, sorted by gain",
x = "Life expectancy (years)", y = NULL,
caption = "Data: Gapminder, via the gapminder R package") +
theme_lex_viz(grid = "x", arrows = "x", break_not_zero = "x") +
theme(legend.position = "none")Sources (4)
12 occurrences dans le corpus; indexé par 2 ouvrages
Citer cette fiche
Adresse stablehttps://dataviz.adrientaudiere.com/terme/dumbbell-chart.html
RéférenceTaudière Adrien. 2026. graphique haltère. Dans Visualization Vocabulary, version 1.0.0. IdEst. https://dataviz.adrientaudiere.com/terme/dumbbell-chart.html
BibTeX
@incollection{taudiere2026-dumbbell-chart,
  author    = {Taudière, Adrien},
  title     = {graphique haltère},
  booktitle = {Visualization Vocabulary},
  year      = {2026},
  version   = {1.0.0},
  publisher = {IdEst},
  url       = {https://dataviz.adrientaudiere.com/terme/dumbbell-chart.html},
  note      = {CC0 1.0}
}Fiche créée le 13/10/2026. Texte modifié le 12/11/2026. Images modifiées le 12/11/2026. Chiffres calculés le 22/10/2026.