

 graphique
 en entonnoir de précision
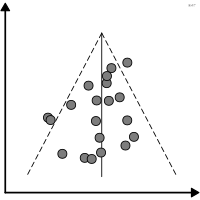
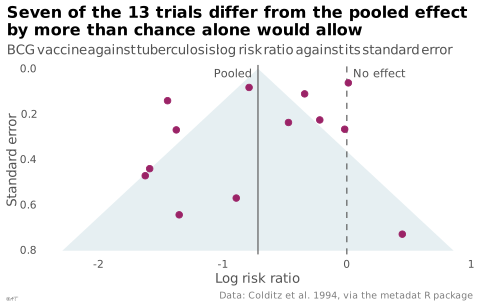
Effet en fonction de la précision pour détecter un biais de publication.
funnel plot
Effect against precision used to detect publication bias.
À ne pas confondre avec le graphique en entonnoir marketing. Wikipédia FR l'appelle simplement « graphique en entonnoir », forme que ce dictionnaire réserve au graphique marketing.
Classification
- graphique
- points et bulles › nuages de points
- écart
- le nom évoque : objet
Canaux
 position sur une échelle commune; principal : effet ; précision en ordonnée
Attestation et synonymies
- terme français : Grelat, Posture et locomotion dans la pathologie dégénérative du rachis lombaire, thèse, Université Bourgogne Franche-Comté, 2019↗
- graphique en entonnoir; Wikipédia en français↗
Littérature scientifique
OpenAlex : 17 070 articles depuis 1972, dont 57 % ces cinq dernières années; surtout en Medicine, Biochemistry, Genetics and Molecular Biology, Psychology; Wikidata
Références séminales
- invention (1984) Light & Pillemer (1984). Summing Up: The Science of Reviewing Research. Harvard University Press (1 440 citations)
- diffusion (1997) Egger et al. (1997). Bias in meta-analysis detected by a simple, graphical test. BMJ (57 316 citations)
Paquets R
- R
metafor::funnel(); GitHub 317 étoiles; dernier commit 2026-10; article (20 481 citations)
Code R de l'exemple ggplot2
library(ggplot2)
library(metafor)
## Log risk ratio of tuberculosis, vaccinated against unvaccinated, in 13
## trials of the BCG vaccine, and the random-effects mean. The funnel is the
## 95% range a trial of each precision would fall in if all shared that mean.
trials <- escalc(measure = "RR", ai = tpos, bi = tneg, ci = cpos, di = cneg, data = dat.bcg)
pooled <- rma(yi, vi, data = trials)
trials$se <- sqrt(trials$vi)
edges <- data.frame(se = c(max(trials$se) * 1.1, 0, max(trials$se) * 1.1),
x = coef(pooled) + qnorm(0.975) * max(trials$se) * 1.1 * c(-1, 0, 1))
p <- ggplot(trials, aes(x = yi, y = se)) +
geom_polygon(data = edges, aes(x = x, y = se), fill = "#2e7891", alpha = 0.12) +
geom_vline(xintercept = coef(pooled), colour = "#535353", linewidth = 0.4) +
geom_vline(xintercept = 0, colour = "#535353", linewidth = 0.4, linetype = "dashed") +
geom_point(size = 2, colour = "#9b2367") +
annotate("text", x = coef(pooled) - 0.05, y = 0.02, label = "Pooled", hjust = 1, size = 3,
colour = "#535353") +
annotate("text", x = 0.05, y = 0.02, label = "No effect", hjust = 0, size = 3, colour = "#535353") +
scale_y_reverse(labels = lex_number, expand = expansion(mult = c(0.02, 0.02))) +
scale_x_continuous(labels = lex_number) +
labs(title = "Seven of the 13 trials differ from the pooled effect\nby more than chance alone would allow",
subtitle = "BCG vaccine against tuberculosis: log risk ratio against its standard error",
x = "Log risk ratio", y = "Standard error",
caption = "Data: Colditz et al. 1994, via the metadat R package") +
theme_lex_viz(grid = "", arrows = "")Sources (3)
5 occurrences dans le corpus; indexé par 1 ouvrage
Citer cette fiche
Adresse stablehttps://dataviz.adrientaudiere.com/terme/funnel-plot.html
RéférenceTaudière Adrien. 2026. graphique en entonnoir de précision. Dans Visualization Vocabulary, version 1.0.0. IdEst. https://dataviz.adrientaudiere.com/terme/funnel-plot.html
BibTeX
@incollection{taudiere2026-funnel-plot,
  author    = {Taudière, Adrien},
  title     = {graphique en entonnoir de précision},
  booktitle = {Visualization Vocabulary},
  year      = {2026},
  version   = {1.0.0},
  publisher = {IdEst},
  url       = {https://dataviz.adrientaudiere.com/terme/funnel-plot.html},
  note      = {CC0 1.0}
}Fiche créée le 13/10/2026. Texte modifié le 02/11/2026. Images modifiées le 12/11/2026. Chiffres calculés le 22/10/2026.