
 encodage
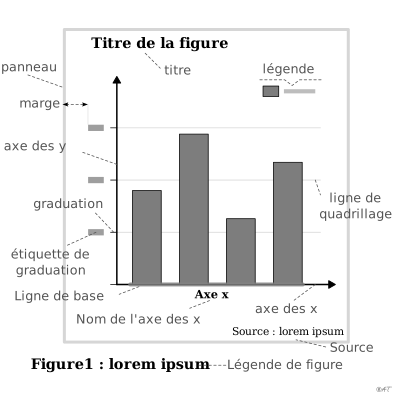
ligne de grille
aussi : quadrillageLigne de fond facilitant la lecture des valeurs.
gridline
Background line helping to read values.
Classification
- encodage
Attestation
- terme français : Bertin, Sémiologie graphique, 1967
Sources (19)
25 occurrences dans le corpus; indexé par 4 ouvrages
Afficher les 19 sources
- Atlas of knowledge: anyone can map
- Bertin, Sémiologie graphique, 1967
- Better data visualizations: a guide for scholars, researchers, and wonks
- Data visualisation: a handbook for data driven design
- Data visualization handbook
- datawrapper.de↗
- Effective data storytelling: how to drive change with data, narrative, and visuals
- Effective data visualization: the right chart for the right data
- How charts lie: getting smarter about visual information
- Les fondamentaux de la visualisation de données
- Practical charts: the essential guide to creating clear, compelling charts for reports ...
- Semiologie graphique: les diagrammes, les réseaux, les cartes.
- The big book of dashboards: visualizing your data using real-world business scenarios
- The functional art: an introduction to information graphics and visualization
- The Truthful Art: Data, Charts, and Maps for Communication
- Visual explanations: images and quantities, evidence and narrative
- Visual strategies for biological data
- Visualizing with text
- Wikipedia in English↗ fr
Citer cette fiche
Adresse stablehttps://dataviz.adrientaudiere.com/terme/gridline.html
RéférenceTaudière Adrien. 2026. ligne de grille. Dans Visualization Vocabulary, version 1.0.0. IdEst. https://dataviz.adrientaudiere.com/terme/gridline.html
BibTeX
@incollection{taudiere2026-gridline,
  author    = {Taudière, Adrien},
  title     = {ligne de grille},
  booktitle = {Visualization Vocabulary},
  year      = {2026},
  version   = {1.0.0},
  publisher = {IdEst},
  url       = {https://dataviz.adrientaudiere.com/terme/gridline.html},
  note      = {CC0 1.0}
}Fiche créée le 13/10/2026. Texte modifié le 13/10/2026. Images modifiées le 22/10/2026. Chiffres calculés le 22/10/2026.