
 graphique
 de densité hexagonal
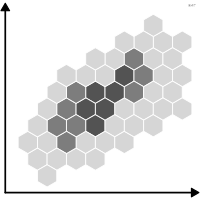
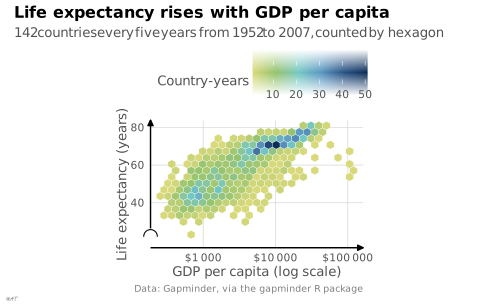
aussi : graphique hexbinNuage de points dont le plan est découpé en hexagones teintés selon le nombre de points.
hexbin plot
also: hexbin density plot, hexagonal bin plot, hexagon density plotScatterplot whose plane is divided into hexagons shaded by the number of points.
Remède à la superposition des points d'un grand nuage. Distinct de la carte en carroyage hexagonal (hexbin-map), qui agrège un territoire. ggplot2 : geom_hex().
Classification
- graphique
- points et bulles › nuages de points
- corrélation, distribution
Attestation
- terme français : Usage courant, non attesté par une source
Littérature scientifique
OpenAlex : 17 articles depuis 2021, dont 71 % ces cinq dernières années; surtout en Biochemistry, Genetics and Molecular Biology, Computer Science, Engineering
Paquets R
Code R de l'exemple ggplot2
library(ggplot2)
library(gapminder)
## Hexagons are regular on screen only if their size in data units follows
## the proportions of the panel, fixed here at `aspect` (height / width).
aspect <- 0.6
bins <- 25
binwidth <- c(diff(range(log10(gapminder$gdpPercap))) / bins,
diff(range(gapminder$lifeExp)) / (bins * aspect))
p <- ggplot(gapminder, aes(x = gdpPercap, y = lifeExp)) +
geom_hex(binwidth = binwidth, colour = "white", linewidth = 0.1) +
scale_x_log10(labels = scales::label_dollar(big.mark = "\u2009")) +
scale_y_continuous(labels = lex_number, breaks = lex_break_breaks, expand = lex_break_expand) +
scale_fill_continuous(labels = lex_number) +
labs(title = "Life expectancy rises with GDP per capita",
subtitle = "142 countries every five years from 1952 to 2007, counted by hexagon",
x = "GDP per capita (log scale)", y = "Life expectancy (years)",
fill = "Country-years",
caption = "Data: Gapminder, via the gapminder R package") +
theme_lex_viz(break_not_zero = "y") +
theme(aspect.ratio = aspect)Citer cette fiche
Adresse stablehttps://dataviz.adrientaudiere.com/terme/hexbin-plot.html
RéférenceTaudière Adrien. 2026. graphique de densité hexagonal. Dans Visualization Vocabulary, version 1.0.0. IdEst. https://dataviz.adrientaudiere.com/terme/hexbin-plot.html
BibTeX
@incollection{taudiere2026-hexbin-plot,
  author    = {Taudière, Adrien},
  title     = {graphique de densité hexagonal},
  booktitle = {Visualization Vocabulary},
  year      = {2026},
  version   = {1.0.0},
  publisher = {IdEst},
  url       = {https://dataviz.adrientaudiere.com/terme/hexbin-plot.html},
  note      = {CC0 1.0}
}Fiche créée le 13/10/2026. Texte modifié le 12/11/2026. Images modifiées le 12/11/2026. Chiffres calculés le 22/10/2026.