

 encodage
échelle logarithmique
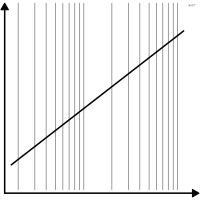
Échelle où une distance constante correspond à un rapport constant.
logarithmic scale
Scale where a constant distance means a constant ratio.
Brinton 1939 appelle ratio chart ou rate-of-change chart la courbe tracée sur une telle échelle : une même pente y signifie un même taux de croissance.
Classification
- encodage
Attestation et synonymies
- terme français : Bertin, Sémiologie graphique, 1967
- définition anglaise : Brinton, Graphic Presentation, 1939↗
- ratio chart; Brinton, Graphic Presentation, 1939↗
- rate-of-change chart; Brinton, Graphic Presentation, 1939↗
Sources (42)
134 occurrences dans le corpus; indexé par 8 ouvrages
Afficher les 42 sources
- Atlas of knowledge: anyone can map
- Barnier, Introduction à R et au tidyverse
- Bertin, Sémiologie graphique, 1967
- Brinton, Graphic Presentation, 1939↗
- Cartography: thematic map design
- Ciccione, Sablé-Meyer & Dehaene, Analyzing the Misperception of Exponential Growth in Graphs, Cognition, 2022↗
- Data points: visualization that means something
- Data Visualisation Guide, data.europa.eu
- Data visualisation: a handbook for data driven design
- Data visualization handbook
- Dehaene, « La perception des graphiques : un nouvel exemple de recyclage neuronal », cours au Collège de France, 2025↗
- Design for information: an introduction to the histories, theories, and best practices ...
- Effective data storytelling: how to drive change with data, narrative, and visuals
- Envisioning information
- Fiches de biostatistique du PBIL (Chessel, Dufour, Thioulouse et al., Lyon 1)
- gka.github.io
- Graphic presentation
- Grosjean & Engels, Science des données biologiques I-III (Université de Mons)
- How charts lie: getting smarter about visual information
- Information graphics
- Information Graphics: A Comprehensive Illustrated Reference
- Interactive data visualization: foundations, techniques, and applications
- La graphique et le traitement graphique de l'information
- Larmarange, guide-R : guide pour l'analyse de données d'enquêtes avec R
- Manuel de datavisualisation - 2e éd, vol. 2
- Milestones in the history of thematic cartography, statistical graphics, and data visua...
- Practical charts: the essential guide to creating clear, compelling charts for reports ...
- Semiologie graphique: les diagrammes, les réseaux, les cartes.
- Semiology of graphics: diagrams, networks, maps
- Show me the numbers: designing tables and graphs to enlighten
- The book of circles: visualizing spheres of knowledge
- The elements of graphing data
- The grammar of graphics
- The infographic history of the world
- The Truthful Art: Data, Charts, and Maps for Communication
- The Wall Street journal guide to information graphics: the dos and don'ts of presenting...
- utilitR, documentation collaborative sur R (Insee)
- Visualizing Uncertainty About the Future
- Wikipedia — Data and information visualization
- Wikipédia en français↗
- Wikipedia in English↗
- Wilke, Fundamentals of Data Visualization, O'Reilly, 2019
Citer cette fiche
Adresse stablehttps://dataviz.adrientaudiere.com/terme/log-scale.html
RéférenceTaudière Adrien. 2026. échelle logarithmique. Dans Visualization Vocabulary, version 1.0.0. IdEst. https://dataviz.adrientaudiere.com/terme/log-scale.html
BibTeX
@incollection{taudiere2026-log-scale,
  author    = {Taudière, Adrien},
  title     = {échelle logarithmique},
  booktitle = {Visualization Vocabulary},
  year      = {2026},
  version   = {1.0.0},
  publisher = {IdEst},
  url       = {https://dataviz.adrientaudiere.com/terme/log-scale.html},
  note      = {CC0 1.0}
}Fiche créée le 13/10/2026. Texte modifié le 13/10/2026. Images modifiées le 13/10/2026. Chiffres calculés le 22/10/2026.