
 graphique
réseau
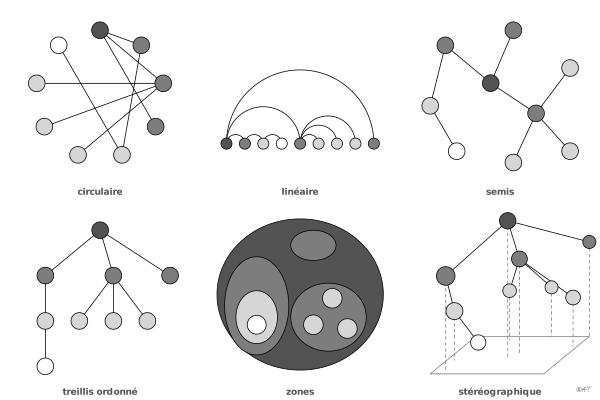
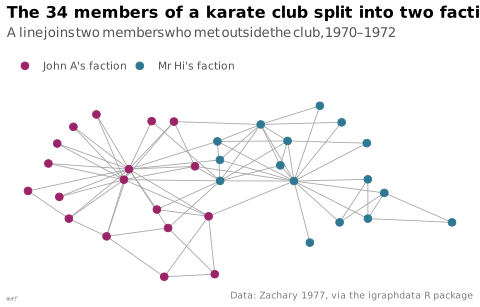
Construction dont « les correspondances dans le plan peuvent s'établir entre tous les éléments d'une même composante ».
network
Construction in which “the correspondences in the plane can be established between all the elements of one and the same component” (Bertin, translated).
À distinguer du diagramme : le réseau met une composante en relation avec elle-même.
Classification
- graphique
Attestation
- terme français : Bertin, Sémiologie graphique, 1967
- définition anglaise : Semiology of graphics: diagrams, networks, maps
Code R de l'exemple ggplot2
library(ggplot2)
library(igraph)
library(ggraph)
## One component, the club's members, set in correspondence with itself:
## a line joins two members who met outside the club.
data("karate", package = "igraphdata")
club <- upgrade_graph(karate)
V(club)$faction <- ifelse(V(club)$Faction == 1, "Mr Hi's faction", "John A's faction")
set.seed(3)
p <- ggraph(club, layout = "stress") +
geom_edge_link(colour = "#a6a6a6", width = 0.3) +
geom_node_point(aes(colour = faction), size = 2.4) +
scale_colour_manual(values = unname(lex_colors[c("plum", "blue")]), name = NULL) +
labs(title = "The 34 members of a karate club split into two factions",
subtitle = "A line joins two members who met outside the club, 1970–1972",
caption = "Data: Zachary 1977, via the igraphdata R package") +
theme_lex_viz(grid = "", arrows = "") +
theme(axis.text = element_blank(), axis.title = element_blank())Sources (116)
2270 occurrences dans le corpus; indexé par 7 ouvrages
Afficher les 116 sources
- 100 diagrams that changed the world: from the earliest cave paintings to the innovation...
- A field guide to digital color
- app.flourish.studio
- Atlas of knowledge: anyone can map
- Audric, de Bellefon & Durieux, « Analyse spatiale descriptive », Manuel d'analyse spatiale (Insee Méthodes n° 131), 2018
- Ault, Nam Liao & Musolino, Principles of Data Science, OpenStax, 2025
- Barnier, Introduction à R et au tidyverse
- Beautiful evidence
- Bertin, Sémiologie graphique, 1967
- Better data visualizations: a guide for scholars, researchers, and wonks
- Bremer & Barone, Chart, CRC Press, 2025
- Brilliant Maps for Curious Minds: 100 New Ways to See the World (Maps for Curious Minds)
- Building Science Graphics: An Illustrated Guide to Communicating Science through Diagra...
- buildingsciencegraphics.com
- Cartographies of Time
- Cartography: thematic map design
- Ciccione & Dehaene, The Neural Bases of Graphical Perception: A Novel Instance of Cultural Recycling?, Journal of Cognitive Neuroscience, 2026↗
- Ciccione et al., Can Non-Human Primates Extract the Linear Trend from a Noisy Scatterplot?, iScience, 2025↗
- Ciccione, « The Perception and Understanding of Patterns and Graphics », colloque Seeing the Mind, Educating the Brain, Collège de France, 2025↗
- Computational statistics in data science
- Cook & Laa, Interactively Exploring High-Dimensional Data and Models in R, Chapman & Hall/CRC, 2026
- Data Feminism
- Data fluency: empowering your organization with effective data communication
- Data points: visualization that means something
- Data sketches
- Data Visualisation Guide, data.europa.eu
- Data visualisation: a handbook for data driven design
- Data visualization handbook
- Data visualization literacy: Definitions, conceptual frameworks, exercises, and assessm...
- Data visualization: a practical introduction
- Data Viz Project
- Data-driven storytelling
- data-to-viz.com
- dataphys.org
- datavizcatalogue.com
- datavizproject.com
- datawrapper.de↗
- Dehaene, « La perception des graphiques : un nouvel exemple de recyclage neuronal », cours au Collège de France, 2025↗
- Design for information: an introduction to the histories, theories, and best practices ...
- Effective data storytelling: how to drive change with data, narrative, and visuals
- Effective data visualization: the right chart for the right data
- Envisioning information
- Exploratory Data Analysis: Descriptive Analysis, Visualization, and Dashboard Design (w...
- Fiches de biostatistique du PBIL (Chessel, Dufour, Thioulouse et al., Lyon 1)
- FranceTerme, Commission d'enrichissement de la langue française
- Friendly & Wainer, A History of Data Visualization and Graphic Communication, Harvard University Press, 2021
- From data to viz
- Fundamentals of computer graphics
- Graphic presentation
- Graphics for learning: proven guidelines for planning, designing, and evaluating visual...
- Grosjean & Engels, Science des données biologiques I-III (Université de Mons)
- Handling and mapping geographic information
- How charts lie: getting smarter about visual information
- How maps work: representation, visualization, and design
- Impossible to ignore: creating memorable content to influence decisions
- Info we trust: how to inspire the world with data
- Information graphics
- Information Graphics: A Comprehensive Illustrated Reference
- Information theory tools for visualization
- Insee, Guide de sémiologie graphique, édition 2017↗
- Interactive data visualization: foundations, techniques, and applications
- jpswalsh.github.io↗
- L’Atlas Molière
- La graphique et le traitement graphique de l'information
- Larmarange et al., analyse-R : introduction à l'analyse d'enquêtes avec R
- Larmarange, guide-R : guide pour l'analyse de données d'enquêtes avec R
- Les fondamentaux de la visualisation de données
- Living in data: a citizen's guide to a better information
- Magrit, manuel d'utilisation (UAR RIATE, CNRS)
- Making and Breaking the Grid, Third Edition
- Making numbers count: the art and science of communicating numbers
- Manuel de datavisualisation - 2e éd, vol. 2
- Milestones in the history of thematic cartography, statistical graphics, and data visua...
- Open Visualization Academy, cours et lettre d'information (Cairo et al.)
- Practical charts: the essential guide to creating clear, compelling charts for reports ...
- Progressive Data Analysis: Roadmap and Research Agenda
- python-graph-gallery.com
- Questions in Dataviz: A Design-Driven Process for Data Visualisation
- Rakotomalala, fascicules de cours de statistique (Université Lyon 2)
- Règles pour l'accessibilité des contenus Web (WCAG) 2.1, traduction française autorisée (W3C)
- Seeing with fresh eyes: meaning, space, data, truth
- Semiologie graphique: les diagrammes, les réseaux, les cartes.
- Semiology of graphics: diagrams, networks, maps
- Série d'ateliers R du CSBQ, version française (Centre de la science de la biodiversité du Québec)
- Show me the numbers: designing tables and graphs to enlighten
- Stop Misusing t-SNE and UMAP for Visual Analytics
- The art of insight: how great visualization designers think
- The big book of dashboards: visualizing your data using real-world business scenarios
- The book of circles: visualizing spheres of knowledge
- The book of trees: visualizing branches of knowledge
- The elements of typographic style
- The eyes have it: A task by data type taxonomy for information visualizations
- The functional art: an introduction to information graphics and visualization
- The golden age of data visualization: how did we get here?
- The grammar of graphics
- The infographic history of the world
- The Minard System: The Complete Statistical Graphics of Charles-Joseph Minard
- The Oxford Handbook of Empirical Aesthetics
- The Truthful Art: Data, Charts, and Maps for Communication
- The visual display of quantitative information
- Thematic Cartography and Geovisualization
- UMATO: Bridging Local and Global Structures for Reliable Visual Analytics With Dimensio...
- utilitR, documentation collaborative sur R (Insee)
- visionscarto.net↗
- Visual complexity: mapping patterns of information
- Visual explanations: images and quantities, evidence and narrative
- Visual strategies for biological data
- Visualization Analysis and Design
- Visualization of Time-Oriented Data
- Visualize This
- Visualizing with text
- Wickham, Navarro & Pedersen, ggplot2: Elegant Graphics for Data Analysis, 3e éd. en ligne↗
- Wikipedia — Data and information visualization
- Wikipédia — Visualisation de données
- Wilke, Fundamentals of Data Visualization, O'Reilly, 2019
- xeno.graphics↗
Citer cette fiche
Adresse stablehttps://dataviz.adrientaudiere.com/terme/network.html
RéférenceTaudière Adrien. 2026. réseau. Dans Visualization Vocabulary, version 1.0.0. IdEst. https://dataviz.adrientaudiere.com/terme/network.html
BibTeX
@incollection{taudiere2026-network,
  author    = {Taudière, Adrien},
  title     = {réseau},
  booktitle = {Visualization Vocabulary},
  year      = {2026},
  version   = {1.0.0},
  publisher = {IdEst},
  url       = {https://dataviz.adrientaudiere.com/terme/network.html},
  note      = {CC0 1.0}
}Fiche créée le 13/10/2026. Texte modifié le 10/11/2026. Images modifiées le 12/11/2026. Chiffres calculés le 22/10/2026.