
 graphique
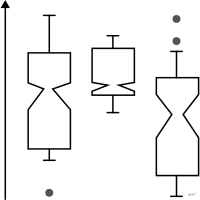
boîte à moustaches à encoches
Boîte creusée d'une encoche figurant l'incertitude sur la médiane.
notched box plot
Box hollowed by a notch showing the uncertainty around the median.
Deux encoches qui ne se recouvrent pas suggèrent des médianes différentes. Vérifié : options notch et varwidth de geom_boxplot() documentées dans Data Visualization: A Practical Introduction (Healy).
Classification
- graphique
- boîtes et densités › boîtes
- distribution
- le nom évoque : nature, objet
Canaux
 position sur une échelle commune; principal : médiane, quartiles, intervalle de confiance de la médiane (l'encoche)
 longueur; secondaire : écart interquartile
 aire; secondaire : écart interquartile (l'aire peut parfois dépendre du nombre de points)
 région de l'espace; principal : groupe
 teinte; secondaire : groupe
Attestation
- terme français : Usage courant, non attesté par une source
- définition anglaise : Data visualization: a practical introduction
Littérature scientifique
OpenAlex : 20 articles depuis 1997, dont 30 % ces cinq dernières années; surtout en Biochemistry, Genetics and Molecular Biology, Medicine, Computer Science
Références séminales
- invention (1978) Mcgill et al. (1978). Variations of Box Plots. The American Statistician (2 618 citations)
Paquets R
- R
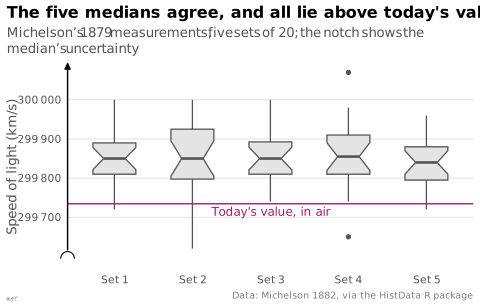
ggplot2::geom_boxplot(); GitHub 7 025 étoiles; dernier commit 2026-10; article (33 455 citations) Avec notch = TRUE.
Code R de l'exemple ggplot2
library(ggplot2)
library(dplyr)
library(tidyr)
library(HistData)
## Stigler's five sets of 20 measurements, in the order Michelson made them.
sets <- as_tibble(MichelsonSets) |>
pivot_longer(everything(), names_to = "set", values_to = "velocity") |>
mutate(set = factor(set, labels = paste("Set", 1:5)), speed = velocity + 299000)
p <- ggplot(sets, aes(x = set, y = speed)) +
geom_hline(yintercept = 299734.5, colour = "#9b2367", linewidth = 0.5) +
geom_boxplot(notch = TRUE, width = 0.55, fill = "#e4e4e4", colour = "#535353",
outlier.size = 1.2) +
annotate("text", x = 3, y = 299734.5, label = "Today's value, in air", colour = "#9b2367",
hjust = 0.5, vjust = 1.4, size = 3.2) +
scale_y_continuous(labels = lex_number, breaks = lex_break_breaks, expand = lex_break_expand) +
labs(title = "The five medians agree, and all lie above today's value",
subtitle = "Michelson's 1879 measurements, five sets of 20; the notch shows the median's uncertainty",
x = NULL, y = "Speed of light (km/s)",
caption = "Data: Michelson 1882, via the HistData R package") +
theme_lex_viz(grid = "y", arrows = "y", break_not_zero = "y")Sources (1)
Citer cette fiche
Adresse stablehttps://dataviz.adrientaudiere.com/terme/notched-box-plot.html
RéférenceTaudière Adrien. 2026. boîte à moustaches à encoches. Dans Visualization Vocabulary, version 1.0.0. IdEst. https://dataviz.adrientaudiere.com/terme/notched-box-plot.html
BibTeX
@incollection{taudiere2026-notched-box-plot,
  author    = {Taudière, Adrien},
  title     = {boîte à moustaches à encoches},
  booktitle = {Visualization Vocabulary},
  year      = {2026},
  version   = {1.0.0},
  publisher = {IdEst},
  url       = {https://dataviz.adrientaudiere.com/terme/notched-box-plot.html},
  note      = {CC0 1.0}
}Fiche créée le 13/10/2026. Texte modifié le 22/10/2026. Images modifiées le 12/11/2026. Chiffres calculés le 22/10/2026.