

 graphique
pyramide des âges
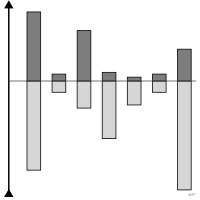
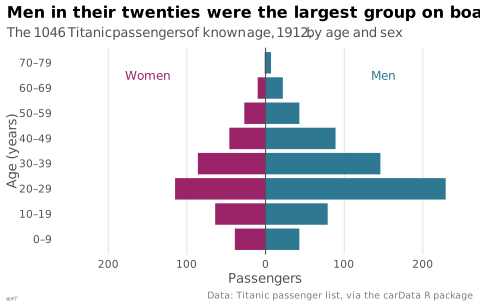
Barres opposées dos à dos comparant deux groupes par classe d'âge.
population pyramid
also: age pyramidBack-to-back bars comparing two groups by age class.
Cas particulier du diagramme en barres divergentes.
Classification
- graphique
- barres › barres divergentes
- distribution; Visual Vocabulary du Financial Times
- le nom évoque : construction
Canaux
 position sur une échelle commune; principal : effectif (de part et d'autre de l'axe central)
 longueur; principal : effectif
 région de l'espace; principal : classe d'âge
 teinte; secondaire : sexe/genre
Attestation
- terme français : Bertin, Sémiologie graphique, 1967
- définition anglaise : Semiology of graphics: diagrams, networks, maps
Littérature scientifique
OpenAlex : 1 331 articles depuis 1964, dont 24 % ces cinq dernières années; surtout en Social Sciences, Medicine, Economics, Econometrics and Finance; Wikidata
Références séminales
Paquets R
- R
ggplot2::geom_col(); GitHub 7 025 étoiles; dernier commit 2026-10; article (33 455 citations) Barres horizontales opposées : les effectifs d'un sexe en valeurs négatives. - R
apyramid::age_pyramid(); GitHub 20 étoiles; dernier commit 2023-02
Code R de l'exemple ggplot2
library(ggplot2)
library(dplyr)
library(carData)
## The 1 046 passengers of known age, by ten-year age group: women to the
## left, men to the right.
ages <- TitanicSurvival |>
filter(!is.na(age)) |>
mutate(group = cut(age, seq(0, 80, by = 10), right = FALSE, include.lowest = TRUE,
labels = paste0(seq(0, 70, by = 10), "–", seq(9, 79, by = 10)))) |>
count(sex, group) |>
mutate(side = ifelse(sex == "female", -n, n))
p <- ggplot(ages, aes(x = side, y = group, fill = sex)) +
geom_col(width = 0.85) +
geom_vline(xintercept = 0, colour = "#535353", linewidth = 0.4) +
annotate("text", x = c(-150, 150), y = 7.5, label = c("Women", "Men"),
colour = c("#9b2367", "#2e7891"), size = 3.2) +
scale_fill_manual(values = c(female = "#9b2367", male = "#2e7891")) +
scale_x_continuous(labels = \(x) lex_number(abs(x)), limits = c(-240, 240)) +
labs(title = "Men in their twenties were the largest group on board",
subtitle = "The 1 046 Titanic passengers of known age, 1912, by age and sex",
x = "Passengers", y = "Age (years)",
caption = "Data: Titanic passenger list, via the carData R package") +
theme_lex_viz(grid = "x", arrows = "") +
theme(legend.position = "none")Sources (30)
51 occurrences dans le corpus; indexé par 6 ouvrages
Afficher les 30 sources
- analysisfunction.civilservice.gov.uk
- app.flourish.studio
- Atlas of knowledge: anyone can map
- Bertin, Sémiologie graphique, 1967
- Cartography: thematic map design
- Data visualisation: a handbook for data driven design
- Data visualization handbook
- Data Viz Project
- datavizcatalogue.com
- datavizproject.com
- datawrapper.de↗
- Effective data visualization: the right chart for the right data
- Friendly & Wainer, A History of Data Visualization and Graphic Communication, Harvard University Press, 2021
- Graphiques : vocabulaire, EBSI Montréal (d'après le GDT)↗
- Information Graphics: A Comprehensive Illustrated Reference
- Insee, Guide de sémiologie graphique, édition 2017↗
- La graphique et le traitement graphique de l'information
- Larmarange et al., analyse-R : introduction à l'analyse d'enquêtes avec R
- Larmarange, guide-R : guide pour l'analyse de données d'enquêtes avec R
- Les fondamentaux de la visualisation de données
- Manuel de datavisualisation - 2e éd, vol. 2
- Milestones in the history of thematic cartography, statistical graphics, and data visua...
- Open Visualization Academy, cours et lettre d'information (Cairo et al.)
- Semiologie graphique: les diagrammes, les réseaux, les cartes.
- Semiology of graphics: diagrams, networks, maps
- The grammar of graphics
- The infographic history of the world
- Wikipédia — Visualisation de données
- Wikipédia en français↗
- Wikipedia in English↗
Citer cette fiche
Adresse stablehttps://dataviz.adrientaudiere.com/terme/population-pyramid.html
RéférenceTaudière Adrien. 2026. pyramide des âges. Dans Visualization Vocabulary, version 1.0.0. IdEst. https://dataviz.adrientaudiere.com/terme/population-pyramid.html
BibTeX
@incollection{taudiere2026-population-pyramid,
  author    = {Taudière, Adrien},
  title     = {pyramide des âges},
  booktitle = {Visualization Vocabulary},
  year      = {2026},
  version   = {1.0.0},
  publisher = {IdEst},
  url       = {https://dataviz.adrientaudiere.com/terme/population-pyramid.html},
  note      = {CC0 1.0}
}Fiche créée le 13/10/2026. Texte modifié le 10/11/2026. Images modifiées le 12/11/2026. Chiffres calculés le 22/10/2026.