

 graphique
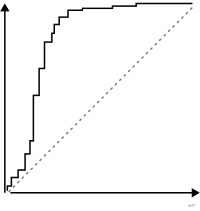
courbe ROC
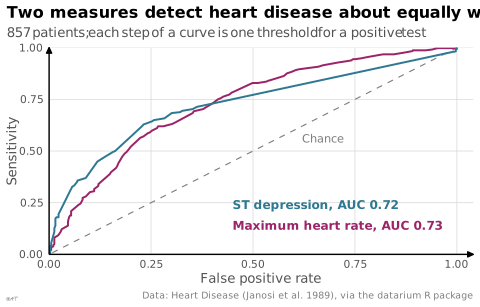
Sensibilité contre taux de faux positifs d'un classifieur.
ROC curve
Sensitivity against false positive rate of a classifier.
Classification
- graphique
- courbes et aires › courbes statistiques
- corrélation
Canaux
 position sur une échelle commune; principal : sensibilité et taux de faux positifs
 aire; secondaire : performance globale (aire sous la courbe (AUC))
Attestation
- terme français : Wikipédia en français↗
Littérature scientifique
OpenAlex : 154 188 articles depuis 1890, dont 49 % ces cinq dernières années; surtout en Medicine, Biochemistry, Genetics and Molecular Biology, Computer Science; Wikidata
Références séminales
- diffusion (1982) Hanley & McNeil (1982). The meaning and use of the area under a receiver operating characteristic (ROC) curve. Radiology (22 260 citations)
Paquets R
- R
pROC::ggroc(); GitHub 138 étoiles; dernier commit 2026-08; article (13 704 citations) - R
plotROC::geom_roc(); GitHub 89 étoiles; dernier commit 2025-08; article (11 citations)
Code R de l'exemple ggplot2
library(ggplot2)
library(dplyr)
library(pROC)
## Heart disease is any narrowing of a coronary artery (`num` above 0).
patients <- datarium::heartdisease |>
filter(!is.na(thalach), !is.na(oldpeak)) |>
mutate(disease = num > 0)
curve_of <- function(predictor, name) {
r <- roc(patients$disease, patients[[predictor]], quiet = TRUE)
tibble(test = sprintf("%s, AUC %.2f", name, auc(r)),
fpr = 1 - r$specificities,
tpr = r$sensitivities) |>
arrange(fpr, tpr)
}
curves <- bind_rows(curve_of("oldpeak", "ST depression"),
curve_of("thalach", "Maximum heart rate"))
tests <- tibble(test = unique(curves$test), fpr = 0.45, tpr = c(0.24, 0.14))
p <- ggplot(curves, aes(x = fpr, y = tpr, colour = test)) +
geom_abline(colour = "#7d7d7d", linewidth = 0.4, linetype = "dashed") +
annotate("text", x = 0.62, y = 0.56, label = "Chance", hjust = 0, size = 3, colour = "#7d7d7d") +
geom_path(linewidth = 0.7) +
geom_text(data = tests, aes(label = test), hjust = 0, size = 3.2, fontface = "bold") +
scale_x_continuous(labels = lex_number, expand = expansion(mult = c(0, 0.04))) +
scale_y_continuous(labels = lex_number, expand = c(0, 0)) +
labs(title = "Two measures detect heart disease about equally well",
subtitle = "857 patients; each step of a curve is one threshold for a positive test",
x = "False positive rate", y = "Sensitivity",
caption = "Data: Heart Disease (Janosi et al. 1989), via the datarium R package") +
theme_lex_viz(grid = "xy", arrows = "xy") +
theme(legend.position = "none")Sources (5)
Citer cette fiche
Adresse stablehttps://dataviz.adrientaudiere.com/terme/roc-curve.html
RéférenceTaudière Adrien. 2026. courbe ROC. Dans Visualization Vocabulary, version 1.0.0. IdEst. https://dataviz.adrientaudiere.com/terme/roc-curve.html
BibTeX
@incollection{taudiere2026-roc-curve,
  author    = {Taudière, Adrien},
  title     = {courbe ROC},
  booktitle = {Visualization Vocabulary},
  year      = {2026},
  version   = {1.0.0},
  publisher = {IdEst},
  url       = {https://dataviz.adrientaudiere.com/terme/roc-curve.html},
  note      = {CC0 1.0}
}Fiche créée le 13/10/2026. Texte modifié le 22/10/2026. Images modifiées le 12/11/2026. Chiffres calculés le 22/10/2026.