
 graphique
petits multiples
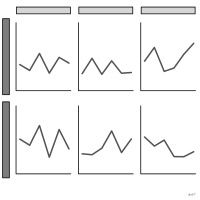
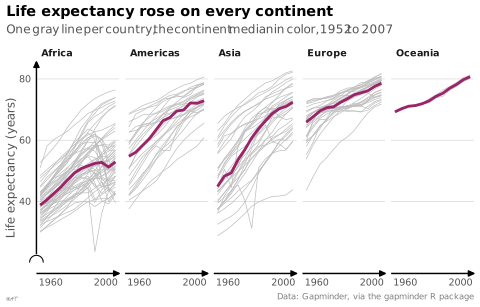
aussi : graphique en treillisSérie de graphiques identiques déclinés par catégorie.
small multiples
also: trellis displaySeries of identical charts repeated across categories.
Classification
- graphique
- compositions
- le nom évoque : objet
Canaux
 position sur une échelle commune; principal : valeurs, sur des axes partagés; Munzner 2014
 région de l'espace; principal : facette; Munzner 2014
Attestation
- terme français : Tufte, The Visual Display of Quantitative Information, 2e éd., 2001
Littérature scientifique
OpenAlex : 360 articles depuis 1961, dont 23 % ces cinq dernières années; surtout en Computer Science, Mathematics, Social Sciences; Wikidata
Références séminales
- premier usage connu (1630) Scheiner (1630). Rosa Ursina sive Sol; Andrews 2017
- formalisation (1983) Tufte (1983). The Visual Display of Quantitative Information. Graphics Press
Paquets R
- R
ggplot2::facet_wrap(); GitHub 7 025 étoiles; dernier commit 2026-10; article (33 455 citations)
Code R de l'exemple ggplot2
library(ggplot2)
library(dplyr)
library(gapminder)
medians <- gapminder |>
group_by(continent, year) |>
summarise(lifeExp = median(lifeExp), .groups = "drop")
p <- ggplot(gapminder, aes(x = year, y = lifeExp)) +
geom_line(aes(group = country), colour = "#bdbdbd", linewidth = 0.25) +
geom_line(data = medians, colour = "#9b2367", linewidth = 1) +
facet_wrap(vars(continent), nrow = 1) +
scale_x_continuous(breaks = c(1960, 2000)) +
scale_y_continuous(labels = lex_number, breaks = lex_break_breaks, expand = lex_break_expand) +
labs(title = "Life expectancy rose on every continent",
subtitle = "One gray line per country, the continent median in color, 1952 to 2007",
x = NULL, y = "Life expectancy (years)",
caption = "Data: Gapminder, via the gapminder R package") +
theme_lex_viz(base_size = 9, grid = "y", break_not_zero = "y")Sources (52)
311 occurrences dans le corpus; indexé par 12 ouvrages
Afficher les 52 sources
- analysisfunction.civilservice.gov.uk
- app.flourish.studio
- Atlas of knowledge: anyone can map
- Beautiful evidence
- Better data visualizations: a guide for scholars, researchers, and wonks
- Building Science Graphics: An Illustrated Guide to Communicating Science through Diagra...
- Cartography: thematic map design
- cedricscherer.com↗
- Data Feminism
- Data sketches
- Data Visualisation Guide, data.europa.eu
- Data visualisation: a handbook for data driven design
- Data visualization handbook
- Data visualization: a practical introduction
- Data-driven storytelling
- dataphys.org
- datawrapper.de↗
- Dehaene, « La perception des graphiques : un nouvel exemple de recyclage neuronal », cours au Collège de France, 2025↗
- Effective data storytelling: how to drive change with data, narrative, and visuals
- Effective data visualization: the right chart for the right data
- Envisioning information
- Friendly & Wainer, A History of Data Visualization and Graphic Communication, Harvard University Press, 2021
- Fundamentals of computer graphics
- Handling and mapping geographic information
- How maps work: representation, visualization, and design
- Info we trust: how to inspire the world with data
- Larmarange et al., analyse-R : introduction à l'analyse d'enquêtes avec R
- Les fondamentaux de la visualisation de données
- Milestones in the history of thematic cartography, statistical graphics, and data visua...
- Open Visualization Academy, cours et lettre d'information (Cairo et al.)
- Practical charts: the essential guide to creating clear, compelling charts for reports ...
- Questions in Dataviz: A Design-Driven Process for Data Visualisation
- Seeing with fresh eyes: meaning, space, data, truth
- Série d'ateliers R du CSBQ, version française (Centre de la science de la biodiversité du Québec)
- Show me the numbers: designing tables and graphs to enlighten
- The art of insight: how great visualization designers think
- The book of trees: visualizing branches of knowledge
- The grammar of graphics
- The Truthful Art: Data, Charts, and Maps for Communication
- The visual display of quantitative information
- Thematic Cartography and Geovisualization
- Tufte, The Visual Display of Quantitative Information, 2e éd., 2001
- UMATO: Bridging Local and Global Structures for Reliable Visual Analytics With Dimensio...
- Visual explanations: images and quantities, evidence and narrative
- Visual strategies for biological data
- Visualization Analysis and Design
- Visualization of Time-Oriented Data
- Visualizing with text
- Wickham, Çetinkaya-Rundel & Grolemund, R for Data Science, 2e éd., 2023
- Wickham, Navarro & Pedersen, ggplot2: Elegant Graphics for Data Analysis, 3e éd. en ligne↗
- Wikipedia in English↗
- Wilke, Fundamentals of Data Visualization, O'Reilly, 2019
Citer cette fiche
Adresse stablehttps://dataviz.adrientaudiere.com/terme/small-multiples.html
RéférenceTaudière Adrien. 2026. petits multiples. Dans Visualization Vocabulary, version 1.0.0. IdEst. https://dataviz.adrientaudiere.com/terme/small-multiples.html
BibTeX
@incollection{taudiere2026-small-multiples,
  author    = {Taudière, Adrien},
  title     = {petits multiples},
  booktitle = {Visualization Vocabulary},
  year      = {2026},
  version   = {1.0.0},
  publisher = {IdEst},
  url       = {https://dataviz.adrientaudiere.com/terme/small-multiples.html},
  note      = {CC0 1.0}
}Fiche créée le 13/10/2026. Texte modifié le 12/11/2026. Images modifiées le 12/11/2026. Chiffres calculés le 22/10/2026.