

 graphique
streamgraph
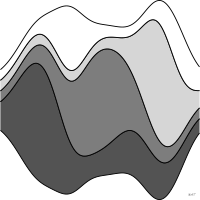
aussi : graphique en fluxAires empilées autour d'une base centrale flottante.
streamgraph
Stacked areas around a floating central baseline.
Terme anglais conservé en français.
Classification
- graphique
- courbes et aires › aires
- évolution dans le temps; Visual Vocabulary du Financial Times
- le nom évoque : nature
Canaux
 position sur une échelle commune; principal : temps; Munzner 2014
 longueur; principal : valeur de chaque couche (épaisseur); Munzner 2014
 aire; secondaire : valeur de chaque couche; Munzner 2014
 teinte; principal : série; Munzner 2014
Attestation
- terme français : Lagnel, Manuel de datavisualisation, Dunod, 2021
- définition anglaise : Data Visualisation Guide, data.europa.eu
Littérature scientifique
OpenAlex : 68 articles depuis 2011, dont 26 % ces cinq dernières années; surtout en Computer Science, Social Sciences, Biochemistry, Genetics and Molecular Biology; Wikidata
Références séminales
- invention (2000) Havre, Hetzler & Nowell (2000). ThemeRiver: visualizing theme changes over time. IEEE Symposium on Information Visualization (436 citations)
- formalisation (2008) Byron & Wattenberg (2008). Stacked Graphs – Geometry & Aesthetics. IEEE Transactions on Visualization and Computer Graphics (347 citations)
Paquets R
- R
ggstream::geom_stream(); GitHub 208 étoiles; dernier commit 2021-05 Retiré du CRAN : à installer depuis GitHub.
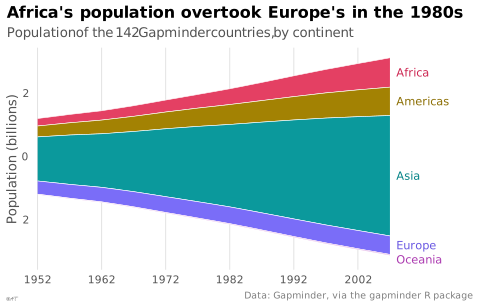
Code R de l'exemple ggplot2
library(ggplot2)
library(dplyr)
library(gapminder)
## Stacked areas centred on zero: each year's stack is shifted down by half its total.
streams <- gapminder |>
group_by(year, continent) |>
summarise(pop = sum(as.numeric(pop)) / 1e9, .groups = "drop") |>
group_by(year) |>
arrange(desc(continent), .by_group = TRUE) |>
mutate(top = cumsum(pop) - sum(pop) / 2, bottom = top - pop) |>
ungroup()
names_at <- streams |>
filter(year == 2007) |>
mutate(y = (top + bottom) / 2,
## Oceania's thin stream: its name moved below Europe's.
y = ifelse(continent == "Oceania", y - 0.15, y))
p <- ggplot(streams, aes(x = year, ymin = bottom, ymax = top, fill = continent)) +
geom_ribbon(colour = "white", linewidth = 0.2) +
geom_text(data = names_at, aes(x = 2008, y = y, label = continent, colour = continent),
hjust = 0, size = 3, inherit.aes = FALSE) +
scale_fill_manual(values = continent_colors) +
scale_colour_manual(values = continent_text_colors) +
scale_x_continuous(breaks = seq(1952, 2002, by = 10), expand = expansion(add = c(0.5, 12))) +
scale_y_continuous(labels = \(x) lex_number(abs(x))) +
labs(title = "Africa's population overtook Europe's in the 1980s",
subtitle = "Population of the 142 Gapminder countries, by continent",
x = NULL, y = "Population (billions)",
caption = "Data: Gapminder, via the gapminder R package") +
theme_lex_viz(grid = "x", arrows = "") +
theme(legend.position = "none")Sources (16)
45 occurrences dans le corpus; indexé par 5 ouvrages
Afficher les 16 sources
- app.flourish.studio
- Better data visualizations: a guide for scholars, researchers, and wonks
- Data Visualisation Guide, data.europa.eu
- Data visualization handbook
- data-to-viz.com
- Design for information: an introduction to the histories, theories, and best practices ...
- Exploratory Data Analysis: Descriptive Analysis, Visualization, and Dashboard Design (w...
- From data to viz
- Lagnel, Manuel de datavisualisation, Dunod, 2021
- Manuel de datavisualisation - 2e éd, vol. 2
- python-graph-gallery.com
- Visualization Analysis and Design
- Visualization of Time-Oriented Data
- Visualize This
- Wikipedia — Data and information visualization
- Wikipedia in English↗
Citer cette fiche
Adresse stablehttps://dataviz.adrientaudiere.com/terme/streamgraph.html
RéférenceTaudière Adrien. 2026. streamgraph. Dans Visualization Vocabulary, version 1.0.0. IdEst. https://dataviz.adrientaudiere.com/terme/streamgraph.html
BibTeX
@incollection{taudiere2026-streamgraph,
  author    = {Taudière, Adrien},
  title     = {streamgraph},
  booktitle = {Visualization Vocabulary},
  year      = {2026},
  version   = {1.0.0},
  publisher = {IdEst},
  url       = {https://dataviz.adrientaudiere.com/terme/streamgraph.html},
  note      = {CC0 1.0}
}Fiche créée le 13/10/2026. Texte modifié le 12/11/2026. Images modifiées le 09/11/2026. Chiffres calculés le 22/10/2026.