
 graphique
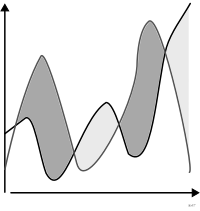
courbe d'excédent et de déficit
aussi : ligne remplie excédent/déficitCourbe dont la surface est remplie de part et d'autre d'une ligne de base pour opposer excédent et déficit.
surplus-deficit filled line
Line whose area is filled either side of a baseline to contrast surplus and deficit.
Classification
- graphique
- courbes et aires › aires
- écart; Visual Vocabulary du Financial Times
Canaux
 position sur une échelle commune; principal : valeur
 aire; secondaire : cumul de l'écart
 teinte; principal : excédent ou déficit
Attestation
- terme français : Visual Vocabulary du Financial Times, version française↗
- définition anglaise : Visual Vocabulary du Financial Times
Littérature scientifique
OpenAlex : 0 articles
Références séminales
- premier usage connu (1786) Playfair (1786). The Commercial and Political Atlas; The visual display of quantitative information
Paquets R
- R
ggh4x::stat_difference(); GitHub 682 étoiles; dernier commit 2025-10
Code R de l'exemple ggplot2
library(ggplot2)
library(dplyr)
library(gapminder)
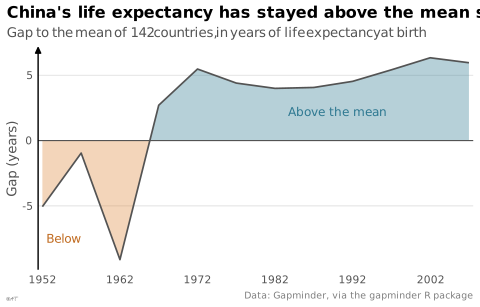
## China's gap to the unweighted mean of the 142 countries, every five years.
gap <- gapminder |>
group_by(year) |>
mutate(gap = lifeExp - mean(lifeExp)) |>
ungroup() |>
filter(country == "China")
## Interpolated every month, so that each fill stops where the line crosses 0.
fine <- as_tibble(approx(gap$year, gap$gap, n = 661)) |>
rename(year = x, gap = y)
p <- ggplot(fine, aes(x = year)) +
geom_ribbon(aes(ymin = 0, ymax = pmax(gap, 0)), fill = "#2e7891", alpha = 0.35) +
geom_ribbon(aes(ymin = pmin(gap, 0), ymax = 0), fill = "#dc863b", alpha = 0.35) +
geom_hline(yintercept = 0, colour = "#535353", linewidth = 0.4) +
geom_line(aes(y = gap), linewidth = 0.6, colour = "#535353") +
annotate("text", x = 1990, y = 2.2, label = "Above the mean", colour = "#2e7891", size = 3.2) +
annotate("text", x = 1952.5, y = -7.5, label = "Below", colour = "#c06a1f", hjust = 0, size = 3.2) +
scale_x_continuous(breaks = seq(1952, 2007, by = 10), expand = expansion(mult = 0.01)) +
scale_y_continuous(labels = lex_number) +
labs(title = "China's life expectancy has stayed above the mean since 1967",
subtitle = "Gap to the mean of 142 countries, in years of life expectancy at birth",
x = NULL, y = "Gap (years)",
caption = "Data: Gapminder, via the gapminder R package") +
theme_lex_viz(grid = "y", arrows = "y")Sources (2)
Citer cette fiche
Adresse stablehttps://dataviz.adrientaudiere.com/terme/surplus-deficit-filled-line.html
RéférenceTaudière Adrien. 2026. courbe d'excédent et de déficit. Dans Visualization Vocabulary, version 1.0.0. IdEst. https://dataviz.adrientaudiere.com/terme/surplus-deficit-filled-line.html
BibTeX
@incollection{taudiere2026-surplus-deficit-filled-line,
  author    = {Taudière, Adrien},
  title     = {courbe d'excédent et de déficit},
  booktitle = {Visualization Vocabulary},
  year      = {2026},
  version   = {1.0.0},
  publisher = {IdEst},
  url       = {https://dataviz.adrientaudiere.com/terme/surplus-deficit-filled-line.html},
  note      = {CC0 1.0}
}Fiche créée le 13/10/2026. Texte modifié le 12/11/2026. Images modifiées le 02/11/2026. Chiffres calculés le 22/10/2026.