
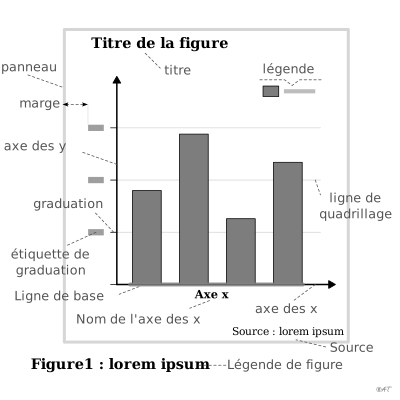
 encodage
graduation
aussi : marque de graduationRepère marquant une valeur sur un axe.
tick mark
Marker indicating a value on an axis.
Classification
- encodage
Attestation
- terme français : Grand dictionnaire terminologique, OQLF (via l'EBSI, Montréal)
- définition anglaise : The elements of graphing data
Sources (32)
91 occurrences dans le corpus; indexé par 5 ouvrages
Afficher les 32 sources
- analysisfunction.civilservice.gov.uk
- Better data visualizations: a guide for scholars, researchers, and wonks
- Cartography: thematic map design
- Ciccione, Sablé-Meyer & Dehaene, Analyzing the Misperception of Exponential Growth in Graphs, Cognition, 2022↗
- Data fluency: empowering your organization with effective data communication
- Data points: visualization that means something
- Data sketches
- Data visualization handbook
- dataphys.org
- Design for information: an introduction to the histories, theories, and best practices ...
- Effective data visualization: the right chart for the right data
- Grand dictionnaire terminologique, OQLF (via l'EBSI, Montréal)
- Graphic presentation
- How charts lie: getting smarter about visual information
- Information Graphics: A Comprehensive Illustrated Reference
- Larmarange, guide-R : guide pour l'analyse de données d'enquêtes avec R
- LibreTexts Statistics, chapitres de manuels sur les figures
- Magrit, manuel d'utilisation (UAR RIATE, CNRS)
- Making numbers count: the art and science of communicating numbers
- Practical charts: the essential guide to creating clear, compelling charts for reports ...
- Rakotomalala, fascicules de cours de statistique (Université Lyon 2)
- royal-statistical-society.github.io
- Show me the numbers: designing tables and graphs to enlighten
- The book of circles: visualizing spheres of knowledge
- The elements of graphing data
- The grammar of graphics
- The Truthful Art: Data, Charts, and Maps for Communication
- The visual display of quantitative information
- Thematic Cartography and Geovisualization
- utilitR, documentation collaborative sur R (Insee)
- Visualization of Time-Oriented Data
- Wickham, Navarro & Pedersen, ggplot2: Elegant Graphics for Data Analysis, 3e éd. en ligne↗
Citer cette fiche
Adresse stablehttps://dataviz.adrientaudiere.com/terme/tick.html
RéférenceTaudière Adrien. 2026. graduation. Dans Visualization Vocabulary, version 1.0.0. IdEst. https://dataviz.adrientaudiere.com/terme/tick.html
BibTeX
@incollection{taudiere2026-tick,
  author    = {Taudière, Adrien},
  title     = {graduation},
  booktitle = {Visualization Vocabulary},
  year      = {2026},
  version   = {1.0.0},
  publisher = {IdEst},
  url       = {https://dataviz.adrientaudiere.com/terme/tick.html},
  note      = {CC0 1.0}
}Fiche créée le 13/10/2026. Texte modifié le 10/11/2026. Images modifiées le 22/10/2026. Chiffres calculés le 22/10/2026.