

 graphique
carte en lignes de métro
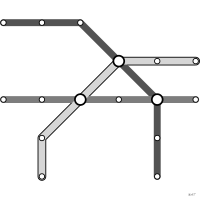
aussi : plan de métroSchéma topologique aux traits contraints à quelques angles.
tube map
also: metro mapTopological schematic with strokes limited to a few angles.
Classification
- graphique
- réseaux et arbres › réseaux schématiques
- spatial
- le nom évoque : construction
Canaux
 région de l'espace; principal : position schématique des stations
 teinte; principal : ligne
 forme; secondaire : station ou correspondance
Attestation
- terme français : Lagnel, Manuel de datavisualisation, Dunod, 2021
Littérature scientifique
OpenAlex : 338 articles depuis 1999, dont 26 % ces cinq dernières années; surtout en Computer Science, Social Sciences, Arts and Humanities
Références séminales
Paquets R
- R
graphlayouts::layout_as_metromap(); GitHub 285 étoiles; dernier commit 2026-07 Calcule la mise en page ; le tracé se fait avec ggraph.
Code R de l'exemple ggplot2
library(ggplot2)
library(dplyr)
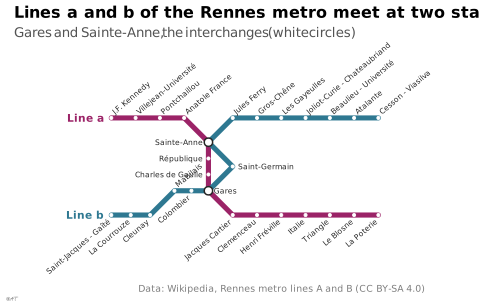
## The two lines of the Rennes metro, stations in order. Coordinates are
## schematic, not geographic: lines run only at 0, 45 and 90 degrees.
## `side` places each name: up or down (slanted), left or right.
line_a <- tribble(
~station, ~x, ~y, ~side,
"J.F. Kennedy", 0, 3, "up",
"Villejean-Université", 1, 3, "up",
"Pontchaillou", 2, 3, "up",
"Anatole France", 3, 3, "up",
"Sainte-Anne", 4, 2, "left",
"République", 4, 1.33, "left",
"Charles de Gaulle", 4, 0.67, "left",
"Gares", 4, 0, "right",
"Jacques Cartier", 5, -1, "down",
"Clemenceau", 6, -1, "down",
"Henri Fréville", 7, -1, "down",
"Italie", 8, -1, "down",
"Triangle", 9, -1, "down",
"Le Blosne", 10, -1, "down",
"La Poterie", 11, -1, "down"
)
line_b <- tribble(
~station, ~x, ~y, ~side,
"Saint-Jacques - Gaîté", 0, -1, "down",
"La Courrouze", 0.8, -1, "down",
"Cleunay", 1.6, -1, "down",
"Mabilais", 2.6, 0, "up",
"Colombier", 3.3, 0, "down",
"Gares", 4, 0, "right",
"Saint-Germain", 5, 1, "right",
"Sainte-Anne", 4, 2, "left",
"Jules Ferry", 5, 3, "up",
"Gros-Chêne", 6, 3, "up",
"Les Gayeulles", 7, 3, "up",
"Joliot-Curie - Chateaubriand", 8, 3, "up",
"Beaulieu - Université", 9, 3, "up",
"Atalante", 10, 3, "up",
"Cesson - Viasilva", 11, 3, "up"
)
stations <- bind_rows(line_a, line_b) |>
add_count(station, name = "lines") |>
distinct(station, .keep_all = TRUE) |>
mutate(interchange = lines > 1)
label <- function(sides, dx, dy, ...) {
geom_text(data = filter(stations, side %in% sides), aes(x = x + dx, y = y + dy, label = station),
size = 2, colour = "#262626", ...)
}
p <- ggplot() +
geom_path(data = line_a, aes(x = x, y = y), colour = "#9b2367", linewidth = 1.8, lineend = "round") +
geom_path(data = line_b, aes(x = x, y = y), colour = "#2e7891", linewidth = 1.8, lineend = "round") +
geom_point(data = filter(stations, !interchange), aes(x = x, y = y), colour = "white", size = 0.8) +
geom_point(data = filter(stations, interchange), aes(x = x, y = y),
shape = 21, fill = "white", colour = "#262626", stroke = 0.8, size = 2.4) +
label("up", 0.08, 0.22, hjust = 0, angle = 40) +
label("down", -0.08, -0.22, hjust = 1, angle = 40) +
label("left", -0.22, 0, hjust = 1) +
label("right", 0.22, 0, hjust = 0) +
annotate("text", x = c(-0.3, -0.3), y = c(3, -1), label = c("Line a", "Line b"), hjust = 1,
colour = c("#9b2367", "#2e7891"), fontface = "bold", size = 2.8) +
coord_equal(xlim = c(-1.6, 12.2), ylim = c(-3.2, 5.2), clip = "off") +
labs(title = "Lines a and b of the Rennes metro meet at two stations",
subtitle = "Gares and Sainte-Anne, the interchanges (white circles)",
x = NULL, y = NULL,
caption = "Data: Wikipedia, Rennes metro lines A and B (CC BY-SA 4.0)") +
theme_lex_viz(grid = "", arrows = "") +
theme(axis.text = element_blank())Sources (11)
29 occurrences dans le corpus; indexé par 1 ouvrage
Afficher les 11 sources
- 100 diagrams that changed the world: from the earliest cave paintings to the innovation...
- Better data visualizations: a guide for scholars, researchers, and wonks
- Brilliant Maps for Curious Minds: 100 New Ways to See the World (Maps for Curious Minds)
- Data visualization handbook
- Design for information: an introduction to the histories, theories, and best practices ...
- Information graphics
- Lagnel, Manuel de datavisualisation, Dunod, 2021
- Manuel de datavisualisation - 2e éd, vol. 2
- Milestones in the history of thematic cartography, statistical graphics, and data visua...
- Visual complexity: mapping patterns of information
- Wikipedia in English↗ fr
Citer cette fiche
Adresse stablehttps://dataviz.adrientaudiere.com/terme/tube-map.html
RéférenceTaudière Adrien. 2026. carte en lignes de métro. Dans Visualization Vocabulary, version 1.0.0. IdEst. https://dataviz.adrientaudiere.com/terme/tube-map.html
BibTeX
@incollection{taudiere2026-tube-map,
  author    = {Taudière, Adrien},
  title     = {carte en lignes de métro},
  booktitle = {Visualization Vocabulary},
  year      = {2026},
  version   = {1.0.0},
  publisher = {IdEst},
  url       = {https://dataviz.adrientaudiere.com/terme/tube-map.html},
  note      = {CC0 1.0}
}Fiche créée le 13/10/2026. Texte modifié le 02/11/2026. Images modifiées le 11/11/2026. Chiffres calculés le 22/10/2026.