

 graphique
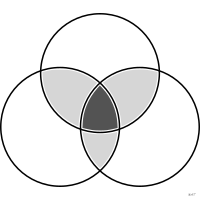
diagramme de Venn
Cercles superposés montrant les intersections d'ensembles.
Venn diagram
Overlapping circles showing set intersections.
Classification
- graphique
- ensembles › diagrammes d'ensembles
- partie d'un tout; Visual Vocabulary du Financial Times
- le nom évoque : nom de personne
Canaux
 région de l'espace; principal : ensembles et intersections
 teinte; secondaire : ensemble
Attestation
- terme français : Lagnel, Manuel de datavisualisation, Dunod, 2021
Littérature scientifique
OpenAlex : 6 353 articles depuis 1951, dont 50 % ces cinq dernières années; surtout en Medicine, Biochemistry, Genetics and Molecular Biology, Social Sciences; Wikidata
Références séminales
Paquets R
- R
ggVennDiagram::ggVennDiagram(); GitHub 314 étoiles; dernier commit 2026-01; article (478 citations) - R
eulerr::venn(); GitHub 151 étoiles; dernier commit 2026-10; article (141 citations)
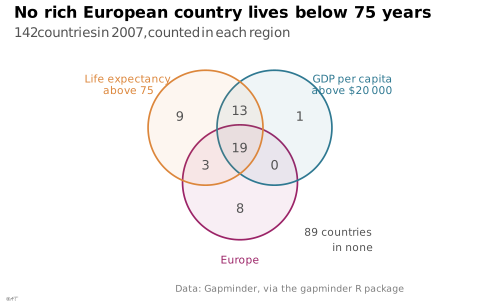
Code R de l'exemple ggplot2
library(ggplot2)
library(dplyr)
library(ggforce)
library(gapminder)
## Three sets of countries in 2007; every region drawn, whatever its count.
countries <- gapminder |>
filter(year == 2007) |>
mutate(long = lifeExp > 75, rich = gdpPercap > 20000, europe = continent == "Europe")
count_in <- function(l, r, e) {
sum(countries$long == l & countries$rich == r & countries$europe == e)
}
circles <- tibble(set = c("Life expectancy\nabove 75", "GDP per capita\nabove $20 000", "Europe"),
x = c(-0.6, 0.6, 0), y = c(0.35, 0.35, -0.6),
lx = c(-1.95, 1.95, 0), ly = c(1.1, 1.1, -1.95))
regions <- tribble(
~x, ~y, ~l, ~r, ~e,
-1.05, 0.55, TRUE, FALSE, FALSE,
1.05, 0.55, FALSE, TRUE, FALSE,
0, -1.05, FALSE, FALSE, TRUE,
0, 0.65, TRUE, TRUE, FALSE,
-0.6, -0.3, TRUE, FALSE, TRUE,
0.6, -0.3, FALSE, TRUE, TRUE,
0, 0, TRUE, TRUE, TRUE
) |>
mutate(n = mapply(count_in, l, r, e))
p <- ggplot() +
geom_circle(data = circles, aes(x0 = x, y0 = y, r = 1, colour = set, fill = set),
alpha = 0.08, linewidth = 0.6) +
geom_text(data = circles, aes(x = lx, y = ly, label = set, colour = set), size = 2.8,
lineheight = 0.9) +
geom_text(data = regions, aes(x = x, y = y, label = n), size = 3.4, colour = "#535353") +
annotate("text", x = 2.3, y = -1.6, hjust = 1, size = 2.8, colour = "#535353",
label = paste(count_in(FALSE, FALSE, FALSE), "countries\nin none")) +
scale_colour_manual(values = unname(lex_colors)) +
scale_fill_manual(values = unname(lex_colors)) +
coord_fixed(xlim = c(-2.6, 2.6), ylim = c(-2.1, 1.45)) +
labs(title = "No rich European country lives below 75 years",
subtitle = "142 countries in 2007, counted in each region",
x = NULL, y = NULL,
caption = "Data: Gapminder, via the gapminder R package") +
theme_lex_viz(grid = "", arrows = "") +
theme(legend.position = "none", axis.text = element_blank())Sources (39)
90 occurrences dans le corpus; indexé par 8 ouvrages
Afficher les 39 sources
- 100 diagrams that changed the world: from the earliest cave paintings to the innovation...
- alg.manifoldapp.org
- Applied Multivariate Statistics in R
- Ault, Nam Liao & Musolino, Principles of Data Science, OpenStax, 2025
- Bremer & Barone, Chart, CRC Press, 2025
- Building Science Graphics: An Illustrated Guide to Communicating Science through Diagra...
- Data fluency: empowering your organization with effective data communication
- Data visualisation: a handbook for data driven design
- Data visualization handbook
- Data Viz Project
- Data-driven storytelling
- data-to-viz.com
- datavizcatalogue.com
- datavizproject.com
- Effective data visualization: the right chart for the right data
- Friendly & Wainer, A History of Data Visualization and Graphic Communication, Harvard University Press, 2021
- From data to viz
- Handling and mapping geographic information
- Info we trust: how to inspire the world with data
- Information Graphics: A Comprehensive Illustrated Reference
- Information theory tools for visualization
- Interactive data visualization: foundations, techniques, and applications
- Lagnel, Manuel de datavisualisation, Dunod, 2021
- Les fondamentaux de la visualisation de données
- Living in data: a citizen's guide to a better information
- Manuel de datavisualisation - 2e éd, vol. 2
- Milestones in the history of thematic cartography, statistical graphics, and data visua...
- Open Visualization Academy, cours et lettre d'information (Cairo et al.)
- Parallel sets: visual analysis of categorical data
- python-graph-gallery.com
- Questions in Dataviz: A Design-Driven Process for Data Visualisation
- Rakotomalala, fascicules de cours de statistique (Université Lyon 2)
- Série d'ateliers R du CSBQ, version française (Centre de la science de la biodiversité du Québec)
- The book of circles: visualizing spheres of knowledge
- Visual strategies for biological data
- Visualizing with text
- Wikipedia — Data and information visualization
- Wikipédia en français↗
- Wikipedia in English↗
Citer cette fiche
Adresse stablehttps://dataviz.adrientaudiere.com/terme/venn-diagram.html
RéférenceTaudière Adrien. 2026. diagramme de Venn. Dans Visualization Vocabulary, version 1.0.0. IdEst. https://dataviz.adrientaudiere.com/terme/venn-diagram.html
BibTeX
@incollection{taudiere2026-venn-diagram,
  author    = {Taudière, Adrien},
  title     = {diagramme de Venn},
  booktitle = {Visualization Vocabulary},
  year      = {2026},
  version   = {1.0.0},
  publisher = {IdEst},
  url       = {https://dataviz.adrientaudiere.com/terme/venn-diagram.html},
  note      = {CC0 1.0}
}Fiche créée le 13/10/2026. Texte modifié le 12/11/2026. Images modifiées le 11/11/2026. Chiffres calculés le 22/10/2026.