
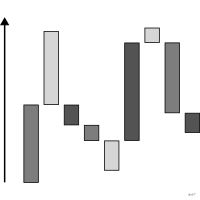
 graphique
 en cascade
aussi : cascade, diagramme waterfallDécomposition d'une variation en contributions positives et négatives.
waterfall chart
Breakdown of a change into positive and negative contributions.
Classification
- graphique
- barres › barres séquentielles
- partie d'un tout, flux; Visual Vocabulary du Financial Times
- le nom évoque : nature
Canaux
 position sur une échelle commune; secondaire : totaux de départ et d'arrivée (seules barres posées sur la base)
 position sur des échelles non alignées; principal : bornes des barres flottantes
 longueur; principal : contribution
 teinte; secondaire : signe de la contribution
Attestation et synonymies
- terme français : Visual Vocabulary du Financial Times, version française↗
- définition anglaise : Visual Vocabulary du Financial Times
- diagramme en cascade; Wikipédia en français↗
Littérature scientifique
OpenAlex : 85 articles depuis 2000, dont 44 % ces cinq dernières années; surtout en Computer Science, Business, Management and Accounting, Engineering; Wikidata
Références séminales
- diffusion (1999) Rasiel (1999). The McKinsey Way. McGraw-Hill; Wikipedia in English
Paquets R
- R
waterfalls::waterfall(); GitHub 15 étoiles; dernier commit 2026-05
Code R de l'exemple ggplot2
library(ggplot2)
library(dplyr)
library(gapminder)
## From the 1952 total to the 2007 total, one step per continent's growth.
totals <- gapminder |>
filter(year %in% c(1952, 2007)) |>
group_by(continent, year) |>
summarise(pop = sum(as.numeric(pop)) / 1e6, .groups = "drop") |>
tidyr::pivot_wider(names_from = year, values_from = pop, names_prefix = "y")
steps <- totals |>
transmute(step = as.character(continent), change = y2007 - y1952) |>
arrange(desc(change)) |>
mutate(end = sum(totals$y1952) + cumsum(change), start = end - change, kind = "Growth")
bars <- bind_rows(
tibble(step = "1952", start = 0, end = sum(totals$y1952), kind = "Total"),
steps,
tibble(step = "2007", start = 0, end = sum(totals$y2007), kind = "Total")
) |>
mutate(x = row_number())
p <- ggplot(bars, aes(xmin = x - 0.4, xmax = x + 0.4, ymin = start, ymax = end, fill = kind)) +
geom_rect() +
geom_segment(data = head(bars, -1), aes(x = x + 0.4, xend = x + 0.6, y = end, yend = end),
colour = "#a6a6a6", linewidth = 0.3, inherit.aes = FALSE) +
scale_fill_manual(values = c(Total = "#a6a6a6", Growth = "#9b2367")) +
scale_x_continuous(breaks = bars$x, labels = bars$step, expand = expansion(add = 0.3)) +
scale_y_continuous(labels = lex_number, expand = expansion(mult = c(0, 0.05))) +
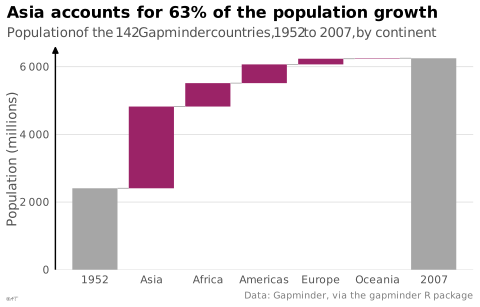
labs(title = "Asia accounts for 63% of the population growth",
subtitle = "Population of the 142 Gapminder countries, 1952 to 2007, by continent",
x = NULL, y = "Population (millions)",
caption = "Data: Gapminder, via the gapminder R package") +
theme_lex_viz(grid = "y", arrows = "y") +
theme(legend.position = "none")Sources (27)
77 occurrences dans le corpus; indexé par 7 ouvrages
Afficher les 27 sources
- app.flourish.studio
- Applied Multivariate Statistics in R
- Better data visualizations: a guide for scholars, researchers, and wonks
- Computational statistics in data science
- Data story: explain data and inspire action through story
- Data Visualisation Guide, data.europa.eu
- Data visualisation: a handbook for data driven design
- Data Viz Project
- datavizproject.com
- datawrapper.de↗
- Effective data storytelling: how to drive change with data, narrative, and visuals
- Effective data visualization: the right chart for the right data
- Info we trust: how to inspire the world with data
- Living in data: a citizen's guide to a better information
- Making and Breaking the Grid, Third Edition
- More Practical Charts
- Practical charts: the essential guide to creating clear, compelling charts for reports ...
- Seeing with fresh eyes: meaning, space, data, truth
- Show me the numbers: designing tables and graphs to enlighten
- Storytelling with data: let's practice!
- The big book of dashboards: visualizing your data using real-world business scenarios
- The Oxford Handbook of Empirical Aesthetics
- Visual explanations: images and quantities, evidence and narrative
- Visual Vocabulary du Financial Times
- Visual Vocabulary du Financial Times, version française↗
- Wikipedia in English↗
- xeno.graphics↗
Citer cette fiche
Adresse stablehttps://dataviz.adrientaudiere.com/terme/waterfall-chart.html
RéférenceTaudière Adrien. 2026. graphique en cascade. Dans Visualization Vocabulary, version 1.0.0. IdEst. https://dataviz.adrientaudiere.com/terme/waterfall-chart.html
BibTeX
@incollection{taudiere2026-waterfall-chart,
  author    = {Taudière, Adrien},
  title     = {graphique en cascade},
  booktitle = {Visualization Vocabulary},
  year      = {2026},
  version   = {1.0.0},
  publisher = {IdEst},
  url       = {https://dataviz.adrientaudiere.com/terme/waterfall-chart.html},
  note      = {CC0 1.0}
}Fiche créée le 13/10/2026. Texte modifié le 12/11/2026. Images modifiées le 02/11/2026. Chiffres calculés le 22/10/2026.