
 graphique
 en épis
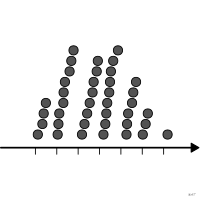
Diagramme en points groupés par classes où chaque point reste placé à sa valeur exacte.
wheat plot
Dot plot binned like a histogram in which each dot stays at its exact value.
Nommé par Few (2017) d'après des rangs de blé courbés par le vent ; forme française non attestée.
Classification
- graphique
- points et bulles › bandes de points
- distribution
- le nom évoque : nature
Attestation
- terme français : Usage courant, non attesté par une source
- définition anglaise : Few, The DataVis Jitterbug: Let's Improve an Old Dance, Visual Business Intelligence Newsletter, 2017↗
Littérature scientifique
OpenAlex : 508 articles depuis 1935, dont 19 % ces cinq dernières années; surtout en Agricultural and Biological Sciences, Environmental Science, Engineering
Références séminales
Code R de l'exemple ggplot2
library(ggplot2)
library(dplyr)
library(HistData)
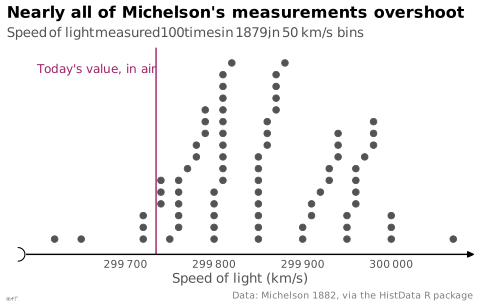
## Binned as for a histogram, 50 km/s wide, but each dot stays at its exact
## value: within a bin, dots climb in order of value.
light <- Michelson |>
mutate(speed = velocity + 299000, bin = floor(velocity / 50)) |>
arrange(speed) |>
group_by(bin) |>
mutate(height = row_number()) |>
ungroup()
p <- ggplot(light, aes(x = speed, y = height)) +
geom_vline(xintercept = 299734.5, colour = "#9b2367", linewidth = 0.5) +
annotate("text", x = 299734.5, y = 15.5, label = "Today's value, in air", colour = "#9b2367",
hjust = 1, nudge_x = -8, size = 3.2) +
geom_point(size = 2, colour = "#535353") +
scale_x_continuous(labels = lex_number, breaks = lex_break_breaks, expand = lex_break_expand) +
scale_y_continuous(NULL, breaks = NULL, limits = c(0.5, 16.5)) +
labs(title = "Nearly all of Michelson's measurements overshoot",
subtitle = "Speed of light measured 100 times in 1879, in 50 km/s bins",
x = "Speed of light (km/s)",
caption = "Data: Michelson 1882, via the HistData R package") +
theme_lex_viz(grid = "", arrows = "x", break_not_zero = "x")Sources (2)
10 occurrences dans le corpus; indexé par 1 ouvrage
Citer cette fiche
Adresse stablehttps://dataviz.adrientaudiere.com/terme/wheat-plot.html
RéférenceTaudière Adrien. 2026. graphique en épis. Dans Visualization Vocabulary, version 1.0.0. IdEst. https://dataviz.adrientaudiere.com/terme/wheat-plot.html
BibTeX
@incollection{taudiere2026-wheat-plot,
  author    = {Taudière, Adrien},
  title     = {graphique en épis},
  booktitle = {Visualization Vocabulary},
  year      = {2026},
  version   = {1.0.0},
  publisher = {IdEst},
  url       = {https://dataviz.adrientaudiere.com/terme/wheat-plot.html},
  note      = {CC0 1.0}
}Fiche créée le 13/10/2026. Texte modifié le 22/10/2026. Images modifiées le 09/11/2026. Chiffres calculés le 22/10/2026.