

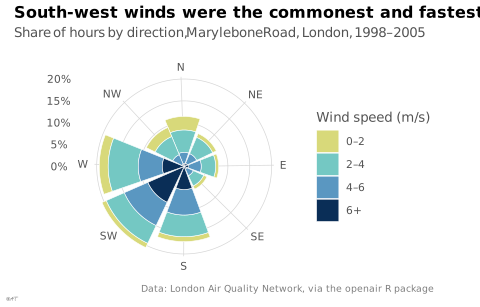

 graphique
rose des vents
Diagramme polaire des fréquences par direction.
wind rose
Polar diagram of frequencies by direction.
En français « rose des vents » désigne aussi la rose des directions des cartes marines. Préciser le contexte statistique quand l'ambiguïté gêne.
Classification
- graphique
- radial › barres polaires
- distribution
- le nom évoque : nature
Canaux
 longueur; principal : fréquence
 région de l'espace; principal : direction (secteur angulaire)
 teinte; principal : classe de vitesse
Attestation
- terme français : Lagnel, Manuel de datavisualisation, Dunod, 2021
Littérature scientifique
OpenAlex : 1 617 articles depuis 1900, dont 28 % ces cinq dernières années; surtout en Environmental Science, Earth and Planetary Sciences, Energy; Wikidata
Références séminales
Paquets R
- R
openair::windRose(); GitHub 368 étoiles; dernier commit 2026-11; article (2 011 citations)
Code R de l'exemple ggplot2
library(ggplot2)
library(dplyr)
library(openair)
## Hourly wind at Marylebone Road, London, 1998-2005: share of the hours by
## direction (eight sectors) and by speed class.
winds <- mydata |>
filter(!is.na(wd), !is.na(ws), ws > 0) |>
mutate(sector = factor(c("N", "NE", "E", "SE", "S", "SW", "W", "NW")[((wd + 22.5) %% 360) %/% 45 + 1],
levels = c("N", "NE", "E", "SE", "S", "SW", "W", "NW")),
speed = cut(ws, c(0, 2, 4, 6, Inf), labels = c("0–2", "2–4", "4–6", "6+"), ordered_result = TRUE)) |>
count(sector, speed) |>
mutate(share = 100 * n / sum(n))
p <- ggplot(winds, aes(x = sector, y = share, fill = speed)) +
geom_col(width = 0.9, colour = "white", linewidth = 0.2) +
coord_radial(start = -pi / 8, expand = FALSE) +
scale_fill_ordinal(type = idest_seq[c(1, 3, 4, 6)], name = "Wind speed (m/s)") +
scale_y_continuous(labels = \(x) paste0(lex_number(x), "%")) +
labs(title = "South-west winds were the commonest and fastest",
subtitle = "Share of hours by direction, Marylebone Road, London, 1998–2005",
x = NULL, y = NULL,
caption = "Data: London Air Quality Network, via the openair R package") +
theme_lex_viz(grid = "xy", arrows = "") +
theme(legend.position = "right")Sources (11)
18 occurrences dans le corpus; indexé par 3 ouvrages
Afficher les 11 sources
- Cartography: thematic map design
- How charts lie: getting smarter about visual information
- How maps work: representation, visualization, and design
- Information Graphics: A Comprehensive Illustrated Reference
- Lagnel, Manuel de datavisualisation, Dunod, 2021
- Manuel de datavisualisation - 2e éd, vol. 2
- Milestones in the history of thematic cartography, statistical graphics, and data visua...
- Practical charts: the essential guide to creating clear, compelling charts for reports ...
- The book of circles: visualizing spheres of knowledge
- The grammar of graphics
- Wikipedia in English↗ fr
Citer cette fiche
Adresse stablehttps://dataviz.adrientaudiere.com/terme/wind-rose.html
RéférenceTaudière Adrien. 2026. rose des vents. Dans Visualization Vocabulary, version 1.0.0. IdEst. https://dataviz.adrientaudiere.com/terme/wind-rose.html
BibTeX
@incollection{taudiere2026-wind-rose,
  author    = {Taudière, Adrien},
  title     = {rose des vents},
  booktitle = {Visualization Vocabulary},
  year      = {2026},
  version   = {1.0.0},
  publisher = {IdEst},
  url       = {https://dataviz.adrientaudiere.com/terme/wind-rose.html},
  note      = {CC0 1.0}
}Fiche créée le 13/10/2026. Texte modifié le 02/11/2026. Images modifiées le 11/11/2026. Chiffres calculés le 22/10/2026.