
 chart
3D chart
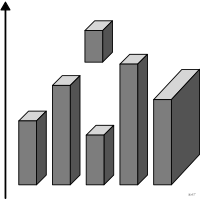
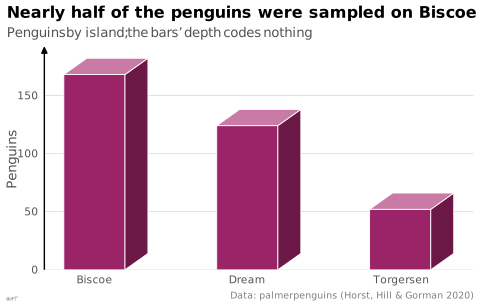
also: pseudo-3D chart, gratuitous 3DChart whose marks are rendered as volumes although the third dimension encodes no data.
Classification
- chart, critique
Channels


Attestation
- English definition: Wilke, Fundamentals of Data Visualization, O'Reilly, 2019
R code of the ggplot2 example
library(ggplot2)
library(dplyr)
library(palmerpenguins)
## Bars drawn as boxes in oblique perspective: a front face that carries
## the count, a top and a side whose depth codes nothing.
dx <- 0.15
dy <- 14
bars <- penguins |>
count(island) |>
mutate(x = seq_along(island), l = x - 0.2, r = x + 0.2)
face <- function(kind, xs, ys) {
bind_rows(lapply(seq_len(nrow(bars)), function(i) {
tibble(island = bars$island[i], kind = kind, x = xs(bars[i, ]), y = ys(bars[i, ]))
}))
}
faces <- bind_rows(
face("side", \(b) c(b$r, b$r + dx, b$r + dx, b$r), \(b) c(0, dy, b$n + dy, b$n)),
face("top", \(b) c(b$l, b$r, b$r + dx, b$l + dx), \(b) c(b$n, b$n, b$n + dy, b$n + dy)),
face("front", \(b) c(b$l, b$r, b$r, b$l), \(b) c(0, 0, b$n, b$n))
) |>
mutate(group = paste(island, kind))
p <- ggplot(faces, aes(x = x, y = y, group = group, fill = kind)) +
geom_polygon(colour = "white", linewidth = 0.3) +
scale_fill_manual(values = c(front = "#9b2367", top = "#c97aa5", side = "#6b1847"), guide = "none") +
scale_x_continuous(breaks = bars$x, labels = bars$island) +
scale_y_continuous(labels = lex_number, expand = expansion(mult = c(0, 0.05))) +
labs(title = "Nearly half of the penguins were sampled on Biscoe Island",
subtitle = "Penguins by island; the bars' depth codes nothing",
x = NULL, y = "Penguins",
caption = "Data: palmerpenguins (Horst, Hill & Gorman 2020)") +
theme_lex_viz(grid = "y", arrows = "y")Sources (5)
5 occurrences in the corpus
- dataphys.org
- Friendly & Wainer, A History of Data Visualization and Graphic Communication, Harvard University Press, 2021
- Practical charts: the essential guide to creating clear, compelling charts for reports ...
- The book of trees: visualizing branches of knowledge
- Wilke, Fundamentals of Data Visualization, O'Reilly, 2019
Cite this entry
Stable addresshttps://dataviz.adrientaudiere.com/en-only/term/3d-chart.html
ReferenceTaudière Adrien. 2026. 3D chart. In Visualization Vocabulary, version 1.0.0. IdEst. https://dataviz.adrientaudiere.com/en-only/term/3d-chart.html
BibTeX
@incollection{taudiere2026-3d-chart,
  author    = {Taudière, Adrien},
  title     = {3D chart},
  booktitle = {Visualization Vocabulary},
  year      = {2026},
  version   = {1.0.0},
  publisher = {IdEst},
  url       = {https://dataviz.adrientaudiere.com/en-only/term/3d-chart.html},
  note      = {CC0 1.0}
}Page created on 2026-10-13. Text last changed on 2026-11-02. Images last changed on 2026-11-12. Numbers computed on 2026-10-22.