
 chart
3D chart
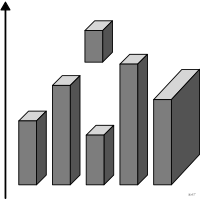
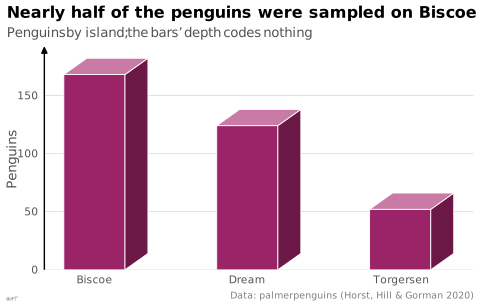
also: pseudo-3D chart, gratuitous 3DChart whose marks are rendered as volumes although the third dimension encodes no data.
graphique en 3D
aussi : graphique en perspectiveGraphique dont les marques sont rendues en volume sans que la troisième dimension code une donnée.
La perspective déforme longueurs et angles. Wilke ne réserve la 3D qu'aux données réellement tridimensionnelles.
Classification
- chart, critique
Channels


Attestation
- French term: Grand dictionnaire terminologique, OQLF (via EBSI, Montreal)
- English definition: Wilke, Fundamentals of Data Visualization, O'Reilly, 2019
R code of the ggplot2 example
library(ggplot2)
library(dplyr)
library(palmerpenguins)
## Bars drawn as boxes in oblique perspective: a front face that carries
## the count, a top and a side whose depth codes nothing.
dx <- 0.15
dy <- 14
bars <- penguins |>
count(island) |>
mutate(x = seq_along(island), l = x - 0.2, r = x + 0.2)
face <- function(kind, xs, ys) {
bind_rows(lapply(seq_len(nrow(bars)), function(i) {
tibble(island = bars$island[i], kind = kind, x = xs(bars[i, ]), y = ys(bars[i, ]))
}))
}
faces <- bind_rows(
face("side", \(b) c(b$r, b$r + dx, b$r + dx, b$r), \(b) c(0, dy, b$n + dy, b$n)),
face("top", \(b) c(b$l, b$r, b$r + dx, b$l + dx), \(b) c(b$n, b$n, b$n + dy, b$n + dy)),
face("front", \(b) c(b$l, b$r, b$r, b$l), \(b) c(0, 0, b$n, b$n))
) |>
mutate(group = paste(island, kind))
p <- ggplot(faces, aes(x = x, y = y, group = group, fill = kind)) +
geom_polygon(colour = "white", linewidth = 0.3) +
scale_fill_manual(values = c(front = "#9b2367", top = "#c97aa5", side = "#6b1847"), guide = "none") +
scale_x_continuous(breaks = bars$x, labels = bars$island) +
scale_y_continuous(labels = lex_number, expand = expansion(mult = c(0, 0.05))) +
labs(title = "Nearly half of the penguins were sampled on Biscoe Island",
subtitle = "Penguins by island; the bars' depth codes nothing",
x = NULL, y = "Penguins",
caption = "Data: palmerpenguins (Horst, Hill & Gorman 2020)") +
theme_lex_viz(grid = "y", arrows = "y")Sources (8)
5 occurrences in the corpus
- dataphys.org
- Friendly & Wainer, A History of Data Visualization and Graphic Communication, Harvard University Press, 2021
- Grand dictionnaire terminologique, OQLF (via EBSI, Montreal)
- Graphiques : vocabulaire, EBSI Montreal (after the GDT)↗
- Les fondamentaux de la visualisation de données
- Practical charts: the essential guide to creating clear, compelling charts for reports ...
- The book of trees: visualizing branches of knowledge
- Wilke, Fundamentals of Data Visualization, O'Reilly, 2019
Cite this entry
Stable addresshttps://dataviz.adrientaudiere.com/en/term/3d-chart.html
ReferenceTaudière Adrien. 2026. 3D chart. In Visualization Vocabulary, version 1.0.0. IdEst. https://dataviz.adrientaudiere.com/en/term/3d-chart.html
BibTeX
@incollection{taudiere2026-3d-chart,
  author    = {Taudière, Adrien},
  title     = {3D chart},
  booktitle = {Visualization Vocabulary},
  year      = {2026},
  version   = {1.0.0},
  publisher = {IdEst},
  url       = {https://dataviz.adrientaudiere.com/en/term/3d-chart.html},
  note      = {CC0 1.0}
}Page created on 2026-10-13. Text last changed on 2026-11-02. Images last changed on 2026-11-12. Numbers computed on 2026-10-22.