
 graphique
 en 3D
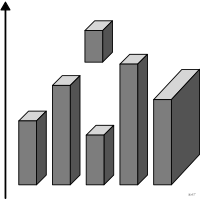
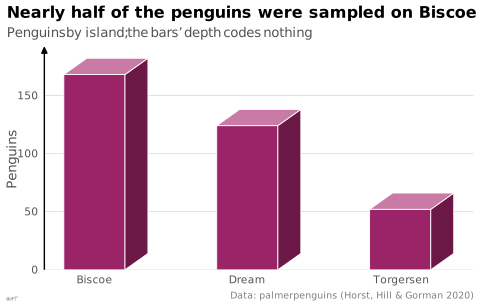
aussi : graphique en perspectiveGraphique dont les marques sont rendues en volume sans que la troisième dimension code une donnée.
3D chart
also: pseudo-3D chart, gratuitous 3DChart whose marks are rendered as volumes although the third dimension encodes no data.
La perspective déforme longueurs et angles. Wilke ne réserve la 3D qu'aux données réellement tridimensionnelles.
Classification
- graphique, critique
Canaux
 profondeur; principal : série ou troisième variable
 volume; secondaire : valeur, lue malgré soi comme un volume
Attestation
- terme français : Grand dictionnaire terminologique, OQLF (via l'EBSI, Montréal)
- définition anglaise : Wilke, Fundamentals of Data Visualization, O'Reilly, 2019
Code R de l'exemple ggplot2
library(ggplot2)
library(dplyr)
library(palmerpenguins)
## Bars drawn as boxes in oblique perspective: a front face that carries
## the count, a top and a side whose depth codes nothing.
dx <- 0.15
dy <- 14
bars <- penguins |>
count(island) |>
mutate(x = seq_along(island), l = x - 0.2, r = x + 0.2)
face <- function(kind, xs, ys) {
bind_rows(lapply(seq_len(nrow(bars)), function(i) {
tibble(island = bars$island[i], kind = kind, x = xs(bars[i, ]), y = ys(bars[i, ]))
}))
}
faces <- bind_rows(
face("side", \(b) c(b$r, b$r + dx, b$r + dx, b$r), \(b) c(0, dy, b$n + dy, b$n)),
face("top", \(b) c(b$l, b$r, b$r + dx, b$l + dx), \(b) c(b$n, b$n, b$n + dy, b$n + dy)),
face("front", \(b) c(b$l, b$r, b$r, b$l), \(b) c(0, 0, b$n, b$n))
) |>
mutate(group = paste(island, kind))
p <- ggplot(faces, aes(x = x, y = y, group = group, fill = kind)) +
geom_polygon(colour = "white", linewidth = 0.3) +
scale_fill_manual(values = c(front = "#9b2367", top = "#c97aa5", side = "#6b1847"), guide = "none") +
scale_x_continuous(breaks = bars$x, labels = bars$island) +
scale_y_continuous(labels = lex_number, expand = expansion(mult = c(0, 0.05))) +
labs(title = "Nearly half of the penguins were sampled on Biscoe Island",
subtitle = "Penguins by island; the bars' depth codes nothing",
x = NULL, y = "Penguins",
caption = "Data: palmerpenguins (Horst, Hill & Gorman 2020)") +
theme_lex_viz(grid = "y", arrows = "y")Sources (8)
5 occurrences dans le corpus
- dataphys.org
- Friendly & Wainer, A History of Data Visualization and Graphic Communication, Harvard University Press, 2021
- Grand dictionnaire terminologique, OQLF (via l'EBSI, Montréal)
- Graphiques : vocabulaire, EBSI Montréal (d'après le GDT)↗
- Les fondamentaux de la visualisation de données
- Practical charts: the essential guide to creating clear, compelling charts for reports ...
- The book of trees: visualizing branches of knowledge
- Wilke, Fundamentals of Data Visualization, O'Reilly, 2019
Citer cette fiche
Adresse stablehttps://dataviz.adrientaudiere.com/terme/3d-chart.html
RéférenceTaudière Adrien. 2026. graphique en 3D. Dans Visualization Vocabulary, version 1.0.0. IdEst. https://dataviz.adrientaudiere.com/terme/3d-chart.html
BibTeX
@incollection{taudiere2026-3d-chart,
  author    = {Taudière, Adrien},
  title     = {graphique en 3D},
  booktitle = {Visualization Vocabulary},
  year      = {2026},
  version   = {1.0.0},
  publisher = {IdEst},
  url       = {https://dataviz.adrientaudiere.com/terme/3d-chart.html},
  note      = {CC0 1.0}
}Fiche créée le 13/10/2026. Texte modifié le 02/11/2026. Images modifiées le 12/11/2026. Chiffres calculés le 22/10/2026.