
 chart
decision tree
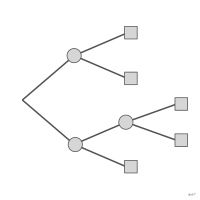
Tree that chains choices and uncertain events, from the root to the leaves, up to the possible outcomes of each path.
Classification
- chart
- networks and trees › schematic networks
- flow
- the name evokes: nature
Channels
 position on common scale; secondary: time of the decision (when the tree follows a time scale (Harris 1996))
 spatial region; main: step along the path
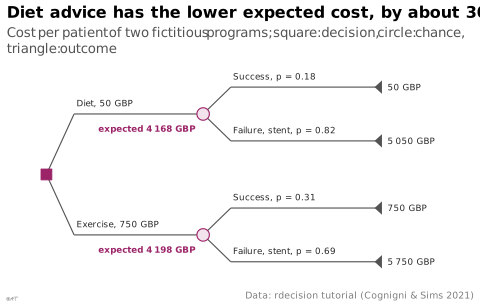
 shape; main: node type (decision square, chance circle, outcome triangle)
Attestation and synonyms
- English definition: Information Graphics: A Comprehensive Illustrated Reference
- decision chart; Information Graphics: A Comprehensive Illustrated Reference
Scientific literature
R packages
R code of the ggplot2 example
library(ggplot2)
library(dplyr)
## The fictitious lifestyle-advice problem of the rdecision tutorial
## (vignette DT00-DecisionTreeTutorial, Cognigni & Sims 2021, GPL-3), copied
## here so that the script does not need rdecision. Diet advice costs 50 GBP,
## the exercise programme 750 GBP; a programme that fails leads to a stent,
## 5000 GBP. Success: 12 of 68 patients on diet, 18 of 58 on exercise.
cost <- c(Diet = 50, Exercise = 750)
cost_stent <- 5000
p_success <- c(Diet = 12 / 68, Exercise = 18 / 58)
## Rolled back: expected cost of each programme per patient.
expected <- cost + (1 - p_success) * cost_stent
## The gap between the rounded costs shown on the tree.
gap <- round(expected[["Exercise"]]) - round(expected[["Diet"]])
stopifnot(round(expected[["Diet"]]) == 4168, round(expected[["Exercise"]]) == 4198, gap == 30)
gbp <- \(x) paste(lex_number(round(x)), "GBP")
chance <- tibble(programme = names(cost), x = 38, y = c(4.5, -4.5))
leaves <- chance |>
reframe(programme = rep(programme, each = 2), outcome = rep(c("Success", "Failure"), 2),
x = 76, y = rep(y, each = 2) + rep(c(2, -2), 2)) |>
mutate(p = ifelse(outcome == "Success", p_success[programme], 1 - p_success[programme]),
path_cost = cost[programme] + ifelse(outcome == "Failure", cost_stent, 0),
edge = paste0(ifelse(outcome == "Failure", "Failure, stent", "Success"), ", p = ",
format(round(p, 2), nsmall = 2)))
## Each branch fans out from its node, then runs level to its child, which
## carries the branch label above it.
fan <- 6
edges <- bind_rows(
transmute(chance, xend = x, yend = y, x = 4, y = 0, xbend = 4 + fan,
label = paste0(programme, ", ", gbp(cost[programme]))),
transmute(leaves, xend = x, yend = y, x = 38, y = chance$y[match(programme, chance$programme)],
xbend = 38 + fan, label = edge)
)
triangles <- leaves |>
rowwise() |>
reframe(leaf = paste(programme, outcome), x = x + c(-0.8, 0.8, 0.8), y = y + c(0, 0.5, -0.5))
p <- ggplot() +
geom_segment(data = edges, aes(x = x, y = y, xend = xbend, yend = yend), colour = "#535353", linewidth = 0.4) +
geom_segment(data = edges, aes(x = xbend, y = yend, xend = xend, yend = yend), colour = "#535353", linewidth = 0.4) +
geom_text(data = edges, aes(x = xbend + 0.5, y = yend + 0.8, label = label), hjust = 0, size = 2.3,
colour = "#262626") +
geom_point(aes(x = 4, y = 0), shape = 22, size = 4, fill = "#9b2367", colour = "#9b2367") +
geom_point(data = chance, aes(x = x, y = y), shape = 21, size = 4, fill = "#f3e3ec", colour = "#9b2367",
stroke = 0.6) +
geom_text(data = chance, aes(x = x - 1.5, y = y - 1.1, label = paste("expected", gbp(expected[programme]))),
hjust = 1, size = 2.3, colour = "#9b2367", fontface = "bold") +
geom_polygon(data = triangles, aes(x = x, y = y, group = leaf), fill = "#535353") +
geom_text(data = leaves, aes(x = x + 2, y = y, label = gbp(path_cost)), hjust = 0, size = 2.3,
colour = "#262626") +
scale_x_continuous(limits = c(0, 92)) +
scale_y_continuous(limits = c(-7.5, 7.5)) +
labs(title = paste("Diet advice has the lower expected cost, by about", gap, "GBP"),
subtitle = "Cost per patient of two fictitious programs; square: decision, circle: chance, triangle: outcome",
x = NULL, y = NULL,
caption = "Data: rdecision tutorial (Cognigni & Sims 2021)") +
theme_lex_viz(grid = "", arrows = "") +
theme(axis.text = element_blank())Sources (18)
69 occurrences in the corpus; indexed by 1 book
Show the 18 sources
- Applied Multivariate Statistics in R
- Ault, Nam Liao & Musolino, Principles of Data Science, OpenStax, 2025
- Computational statistics in data science
- data-to-viz.com
- datawrapper.de↗
- Effective data visualization: the right chart for the right data
- From data to viz
- Information Graphics: A Comprehensive Illustrated Reference
- Information theory tools for visualization
- Living in data: a citizen's guide to a better information
- More Practical Charts
- Open Visualization Academy, courses and newsletter (Cairo et al.)
- Practical charts: the essential guide to creating clear, compelling charts for reports ...
- python-graph-gallery.com
- Seeing with fresh eyes: meaning, space, data, truth
- The book of trees: visualizing branches of knowledge
- Wikipedia — Data and information visualization
- Wikipedia in English↗
Cite this entry
Stable addresshttps://dataviz.adrientaudiere.com/en-only/term/decision-tree.html
ReferenceTaudière Adrien. 2026. decision tree. In Visualization Vocabulary, version 1.0.0. IdEst. https://dataviz.adrientaudiere.com/en-only/term/decision-tree.html
BibTeX
@incollection{taudiere2026-decision-tree,
  author    = {Taudière, Adrien},
  title     = {decision tree},
  booktitle = {Visualization Vocabulary},
  year      = {2026},
  version   = {1.0.0},
  publisher = {IdEst},
  url       = {https://dataviz.adrientaudiere.com/en-only/term/decision-tree.html},
  note      = {CC0 1.0}
}Page created on 2026-11-09. Text last changed on 2026-11-10. Images last changed on 2026-11-12. Numbers computed on 2026-10-22.