
 chart
decision tree
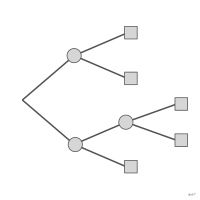
Tree that chains choices and uncertain events, from the root to the leaves, up to the possible outcomes of each path.
arbre de décision
Arbre qui enchaîne, de la racine vers les feuilles, des choix et des événements incertains jusqu'aux issues possibles de chaque chemin.
Au sens de l'aide à la décision : nœuds de décision, de hasard et issues, souvent chiffrés de probabilités et de gains. Le modèle d'apprentissage automatique (CART, rpart) en est un cas, que l'on représente sous cette forme. À distinguer du guide de choix graphique, arbre de décision dont les issues sont des types de graphique.
Classification
- chart
- networks and trees › schematic networks
- flow
- the name evokes: nature
Channels
 position on common scale; secondary: time of the decision (when the tree follows a time scale (Harris 1996))
 spatial region; main: step along the path
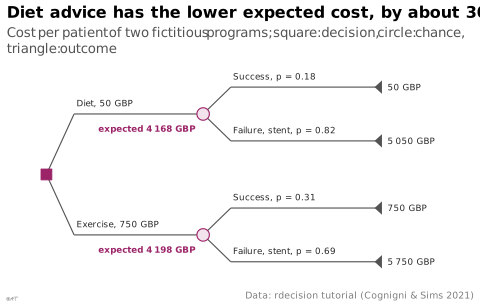
 shape; main: node type (decision square, chance circle, outcome triangle)
Attestation and synonyms
- French term: French Wikipedia↗
- English definition: Information Graphics: A Comprehensive Illustrated Reference
- decision chart; Information Graphics: A Comprehensive Illustrated Reference
- diagramme décisionnel; datavizindex.fr
Scientific literature
R packages
- R
rdecision::DecisionTree(); tutorial; GitHub; paper Classe R6 ; le dessin passe par sa méthode draw().
R code of the ggplot2 example
library(ggplot2)
library(dplyr)
## The fictitious lifestyle-advice problem of the rdecision tutorial
## (vignette DT00-DecisionTreeTutorial, Cognigni & Sims 2021, GPL-3), copied
## here so that the script does not need rdecision. Diet advice costs 50 GBP,
## the exercise programme 750 GBP; a programme that fails leads to a stent,
## 5000 GBP. Success: 12 of 68 patients on diet, 18 of 58 on exercise.
cost <- c(Diet = 50, Exercise = 750)
cost_stent <- 5000
p_success <- c(Diet = 12 / 68, Exercise = 18 / 58)
## Rolled back: expected cost of each programme per patient.
expected <- cost + (1 - p_success) * cost_stent
## The gap between the rounded costs shown on the tree.
gap <- round(expected[["Exercise"]]) - round(expected[["Diet"]])
stopifnot(round(expected[["Diet"]]) == 4168, round(expected[["Exercise"]]) == 4198, gap == 30)
gbp <- \(x) paste(lex_number(round(x)), "GBP")
chance <- tibble(programme = names(cost), x = 38, y = c(4.5, -4.5))
leaves <- chance |>
reframe(programme = rep(programme, each = 2), outcome = rep(c("Success", "Failure"), 2),
x = 76, y = rep(y, each = 2) + rep(c(2, -2), 2)) |>
mutate(p = ifelse(outcome == "Success", p_success[programme], 1 - p_success[programme]),
path_cost = cost[programme] + ifelse(outcome == "Failure", cost_stent, 0),
edge = paste0(ifelse(outcome == "Failure", "Failure, stent", "Success"), ", p = ",
format(round(p, 2), nsmall = 2)))
## Each branch fans out from its node, then runs level to its child, which
## carries the branch label above it.
fan <- 6
edges <- bind_rows(
transmute(chance, xend = x, yend = y, x = 4, y = 0, xbend = 4 + fan,
label = paste0(programme, ", ", gbp(cost[programme]))),
transmute(leaves, xend = x, yend = y, x = 38, y = chance$y[match(programme, chance$programme)],
xbend = 38 + fan, label = edge)
)
triangles <- leaves |>
rowwise() |>
reframe(leaf = paste(programme, outcome), x = x + c(-0.8, 0.8, 0.8), y = y + c(0, 0.5, -0.5))
p <- ggplot() +
geom_segment(data = edges, aes(x = x, y = y, xend = xbend, yend = yend), colour = "#535353", linewidth = 0.4) +
geom_segment(data = edges, aes(x = xbend, y = yend, xend = xend, yend = yend), colour = "#535353", linewidth = 0.4) +
geom_text(data = edges, aes(x = xbend + 0.5, y = yend + 0.8, label = label), hjust = 0, size = 2.3,
colour = "#262626") +
geom_point(aes(x = 4, y = 0), shape = 22, size = 4, fill = "#9b2367", colour = "#9b2367") +
geom_point(data = chance, aes(x = x, y = y), shape = 21, size = 4, fill = "#f3e3ec", colour = "#9b2367",
stroke = 0.6) +
geom_text(data = chance, aes(x = x - 1.5, y = y - 1.1, label = paste("expected", gbp(expected[programme]))),
hjust = 1, size = 2.3, colour = "#9b2367", fontface = "bold") +
geom_polygon(data = triangles, aes(x = x, y = y, group = leaf), fill = "#535353") +
geom_text(data = leaves, aes(x = x + 2, y = y, label = gbp(path_cost)), hjust = 0, size = 2.3,
colour = "#262626") +
scale_x_continuous(limits = c(0, 92)) +
scale_y_continuous(limits = c(-7.5, 7.5)) +
labs(title = paste("Diet advice has the lower expected cost, by about", gap, "GBP"),
subtitle = "Cost per patient of two fictitious programs; square: decision, circle: chance, triangle: outcome",
x = NULL, y = NULL,
caption = "Data: rdecision tutorial (Cognigni & Sims 2021)") +
theme_lex_viz(grid = "", arrows = "") +
theme(axis.text = element_blank())Sources (21)
69 occurrences in the corpus; indexed by 1 book
Show the 21 sources
- Applied Multivariate Statistics in R
- Ault, Nam Liao & Musolino, Principles of Data Science, OpenStax, 2025
- Computational statistics in data science
- data-to-viz.com
- datawrapper.de↗
- Effective data visualization: the right chart for the right data
- French Wikipedia↗
- From data to viz
- Information Graphics: A Comprehensive Illustrated Reference
- Information theory tools for visualization
- Living in data: a citizen's guide to a better information
- More Practical Charts
- Open Visualization Academy, courses and newsletter (Cairo et al.)
- PBIL biostatistics notes (Chessel, Dufour, Thioulouse et al., Lyon 1)
- Practical charts: the essential guide to creating clear, compelling charts for reports ...
- python-graph-gallery.com
- Rakotomalala, statistics course notes (Université Lyon 2)
- Seeing with fresh eyes: meaning, space, data, truth
- The book of trees: visualizing branches of knowledge
- Wikipedia — Data and information visualization
- Wikipedia in English↗
Cite this entry
Stable addresshttps://dataviz.adrientaudiere.com/en/term/decision-tree.html
ReferenceTaudière Adrien. 2026. decision tree. In Visualization Vocabulary, version 1.0.0. IdEst. https://dataviz.adrientaudiere.com/en/term/decision-tree.html
BibTeX
@incollection{taudiere2026-decision-tree,
  author    = {Taudière, Adrien},
  title     = {decision tree},
  booktitle = {Visualization Vocabulary},
  year      = {2026},
  version   = {1.0.0},
  publisher = {IdEst},
  url       = {https://dataviz.adrientaudiere.com/en/term/decision-tree.html},
  note      = {CC0 1.0}
}Page created on 2026-11-09. Text last changed on 2026-11-10. Images last changed on 2026-11-12. Numbers computed on 2026-10-22.